Exploratory Geovisualizations for Supporting the Qualitative Analysis and Synthesis of Place-Related Emotion Data
Abstract
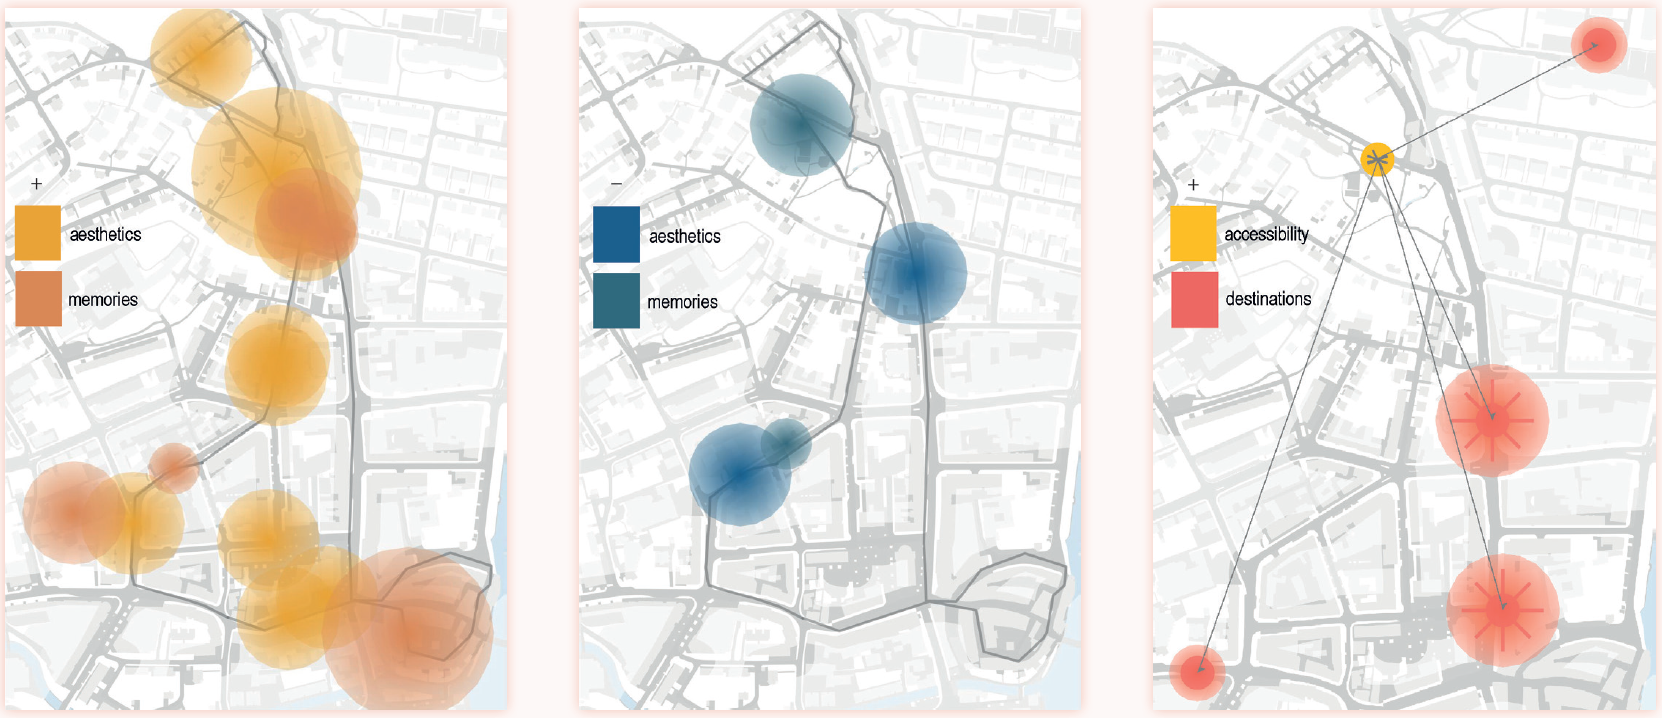
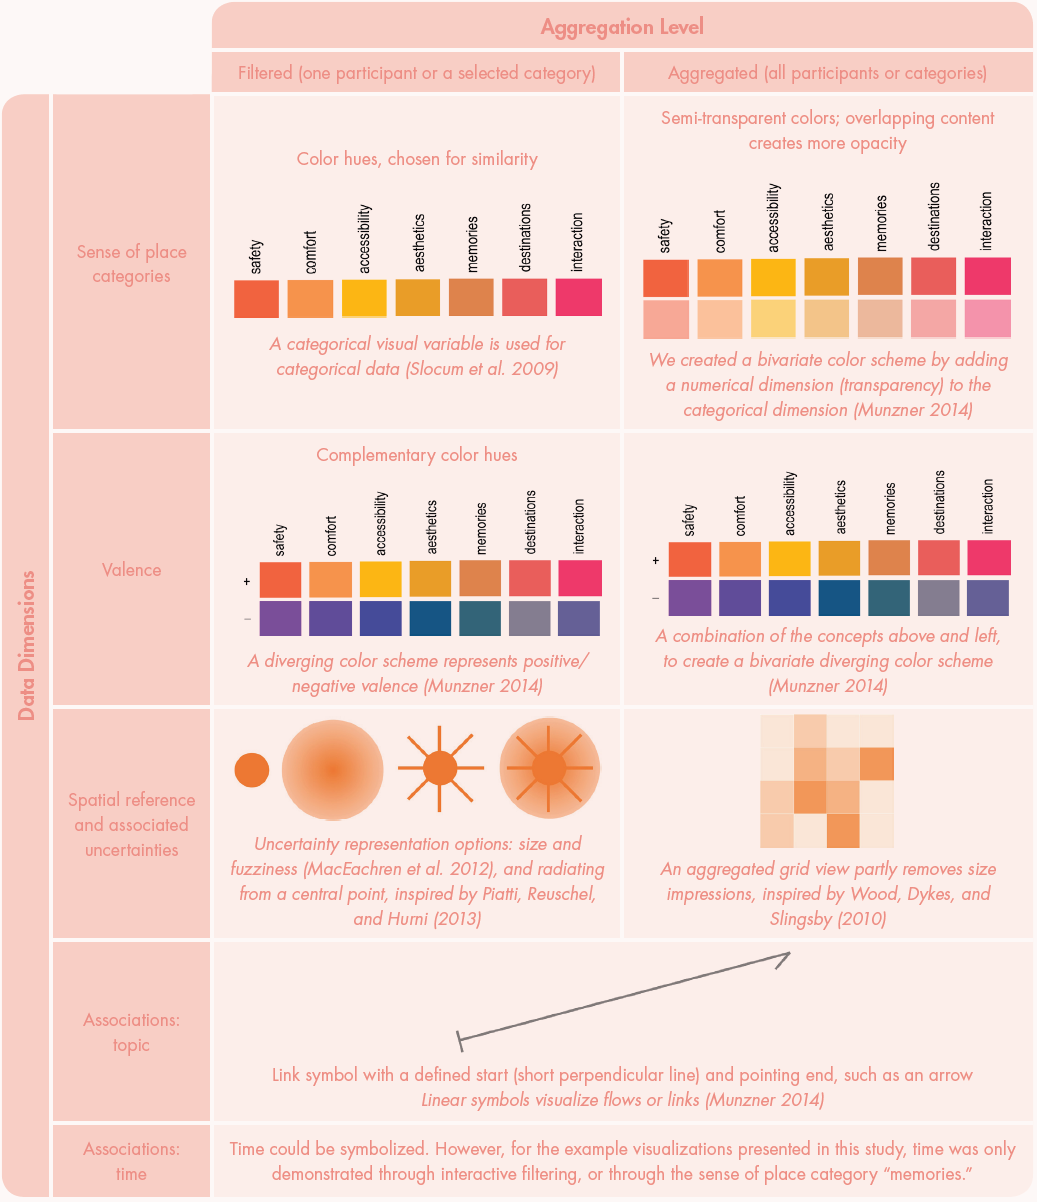
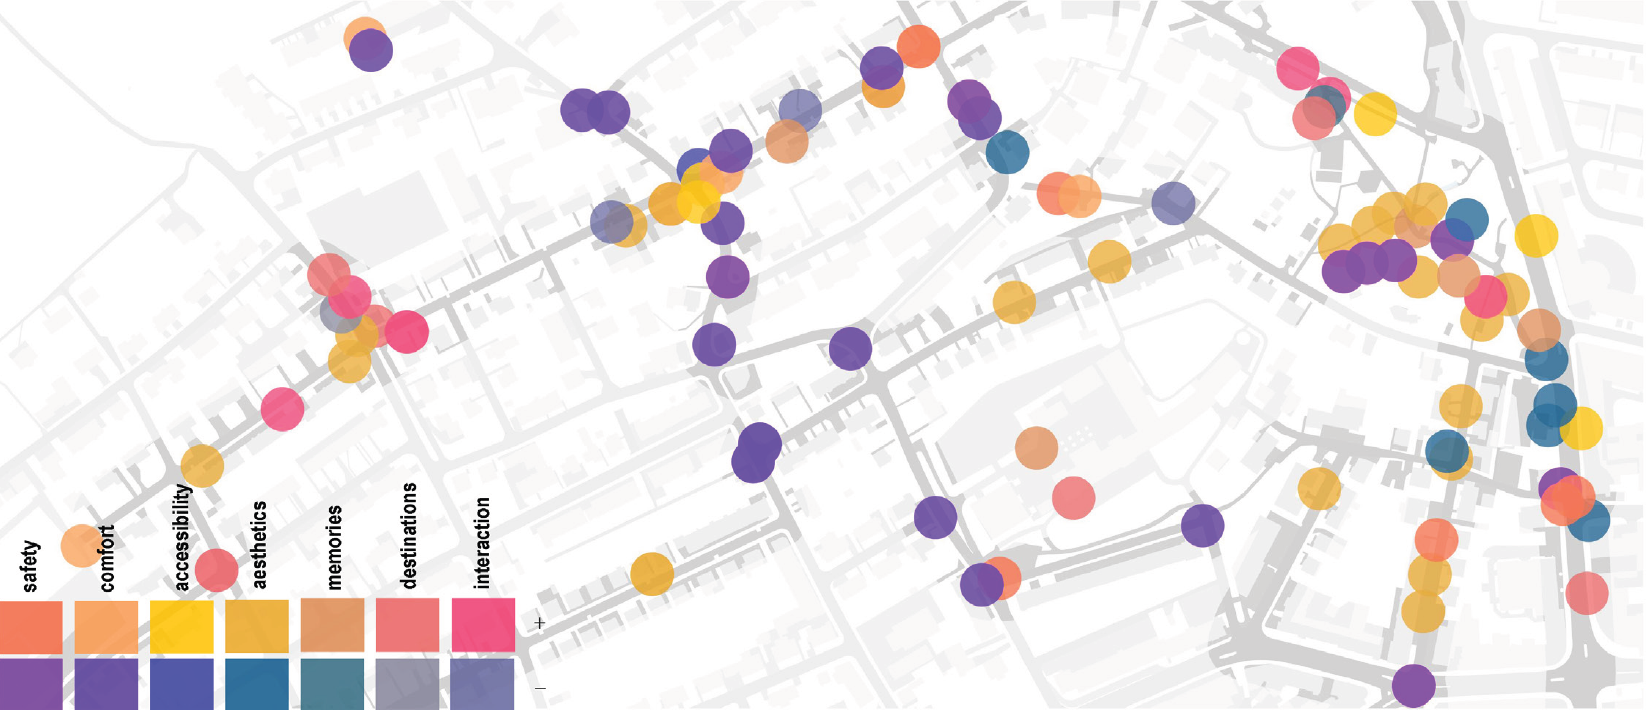
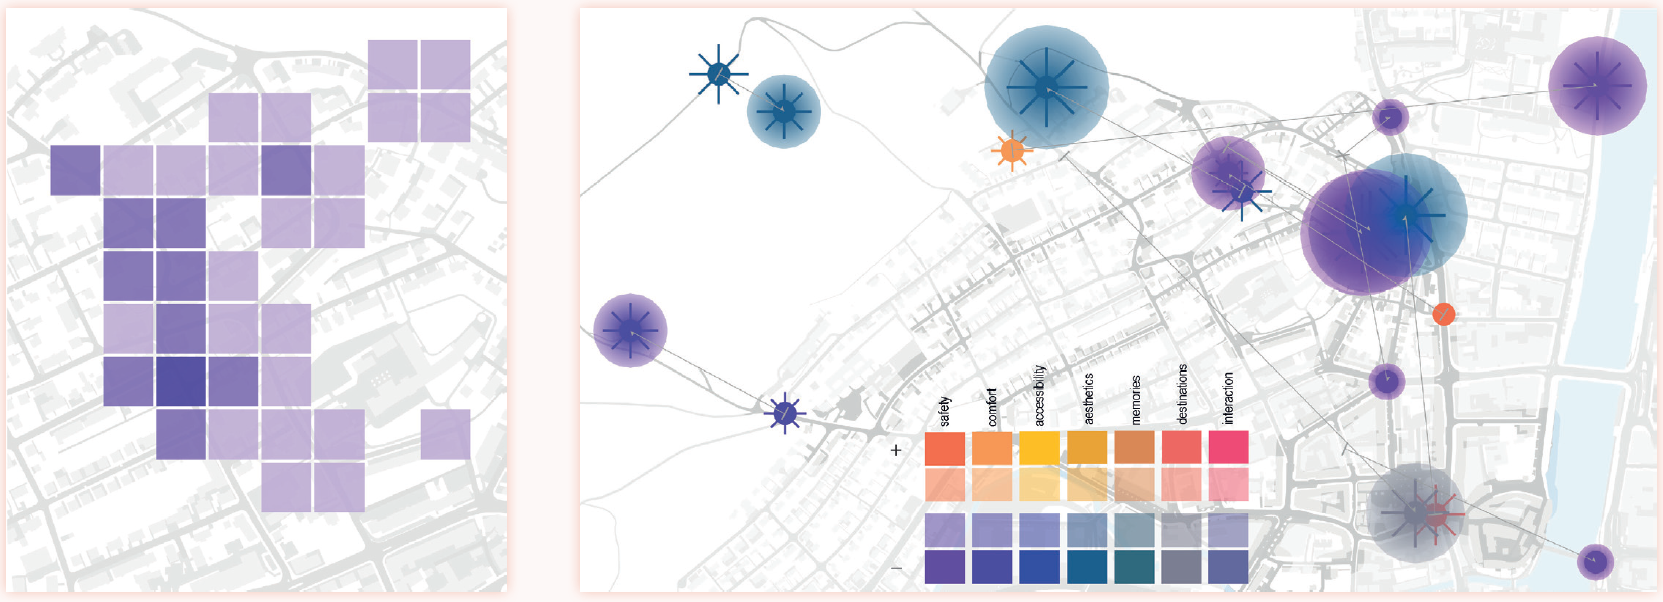
Locations become places through personal significance and experience. While place data are not emotion data, per se, personal significance and experience are often emotional. In this paper, we explore the potential of using visual data exploration to support the qualitative analysis of place-related emotion data. To do so, we draw upon Creswell’s (2009) definition of place to define a generic data model that contains emotion data for a given location and its locale. For each data dimension in our model, we present symbolization options that can be combined to create a range of interactive visualizations, specifically supporting re-expression. We discuss the usefulness of example visualizations, created based on a data set from a pilot study on how elderly women experience their neighborhood. We find that the visualizations support four broad qualitative data analysis tasks: revising categorizations, making connections and relationships, aggregating for synthesis, and corroborating evidence by combining sense of place with locale information to support a holistic interpretation of place data. In conclusion, the paper contributes to the literature in three ways. It provides a generic data model and associated symbolization options, and uses examples to show how place-related emotion data can be visualized. Further, the example visualizations make explicit how re-expression, the combination of emotion data with locale information, and visualization of vagueness and linked data support the analysis of emotion data. Finally, we advocate for visualization-supported qualitative data analysis in interdisciplinary teams so that more suitable maps are used and so that cartographers can better understand and support qualitative data analysis.
Figures
BibTeX
@article{bleisch_exploratoryGeoVisPlaceEmotionData_2019,
 abstract = {Locations become places through personal significance and experience. While place data are not emotion data, per se, personal significance and experience are often emotional. In this paper, we explore the potential of using visual data exploration to support the qualitative analysis of place-related emotion data. To do so, we draw upon Creswell’s (2009) definition of place to define a generic data model that contains emotion data for a given location and its locale. For each data dimension in our model, we present symbolization options that can be combined to create a range of interactive visualizations, specifically supporting re-expression. We discuss the usefulness of example visualizations, created based on a data set from a pilot study on how elderly women experience their neighborhood. We find that the visualizations support four broad qualitative data analysis tasks: revising categorizations, making connections and relationships, aggregating for synthesis, and corroborating evidence by combining sense of place with locale information to support a holistic interpretation of place data. In conclusion, the paper contributes to the literature in three ways. It provides a generic data model and associated symbolization options, and uses examples to show how place-related emotion data can be visualized. Further, the example visualizations make explicit how re-expression, the combination of emotion data with locale information, and visualization of vagueness and linked data support the analysis of emotion data. Finally, we advocate for visualization-supported qualitative data analysis in interdisciplinary teams so that more suitable maps are used and so that cartographers can better understand and support qualitative data analysis.},
 author = {Bleisch, Susanne and Hollenstein, Daria},
 doi = {10.14714/CP91.1437},
 journal = {Cartographic Perspectives},
 number = {91},
 title = {Exploratory {Geovisualizations} for {Supporting} the {Qualitative} {Analysis} and {Synthesis} of {Place}-{Related} {Emotion} {Data}},
 url = {https://cartographicperspectives.org/index.php/journal/article/view/1437},
 urldate = {2026-03-25},
 year = {2019}
}