Radial network visualization - Linking spatial and non-spatial networks in a connected circular layout
Abstract
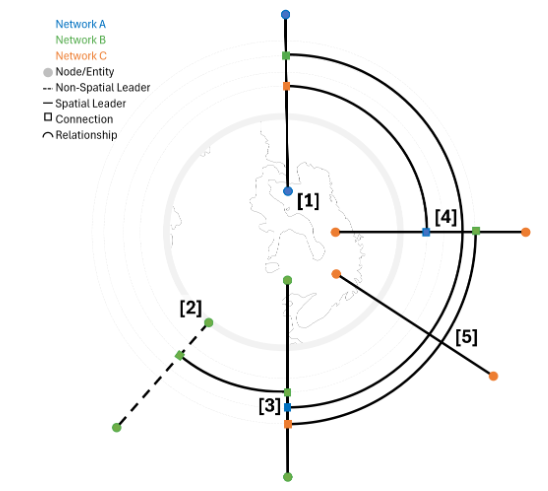
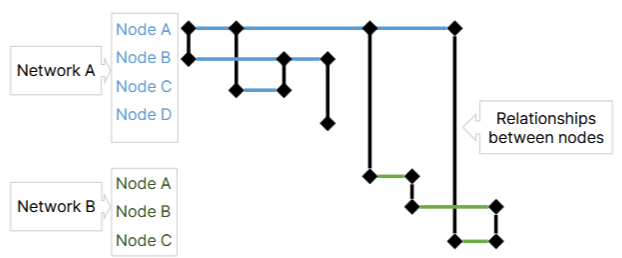
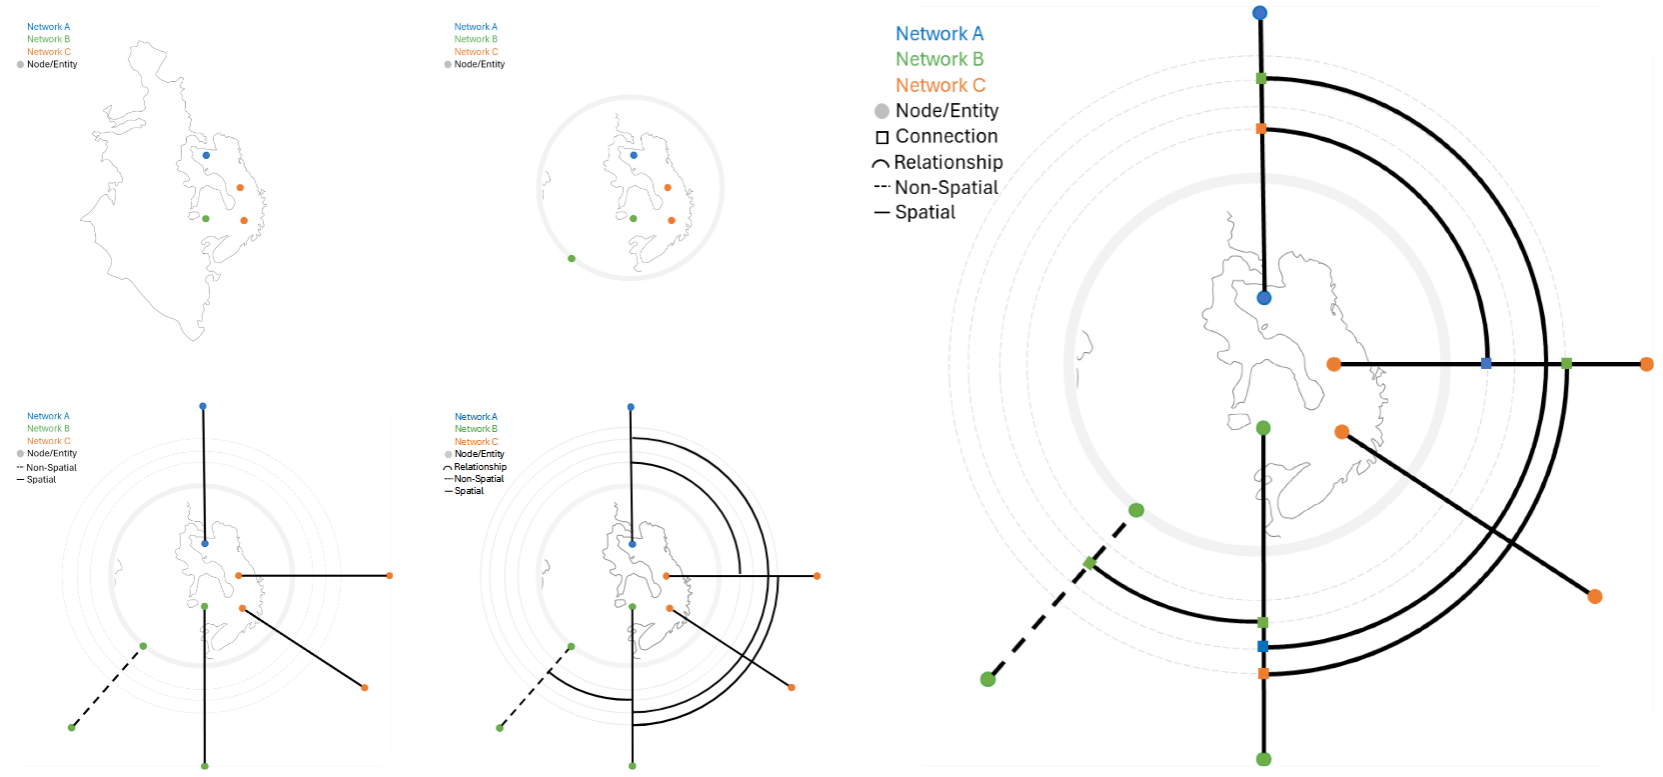
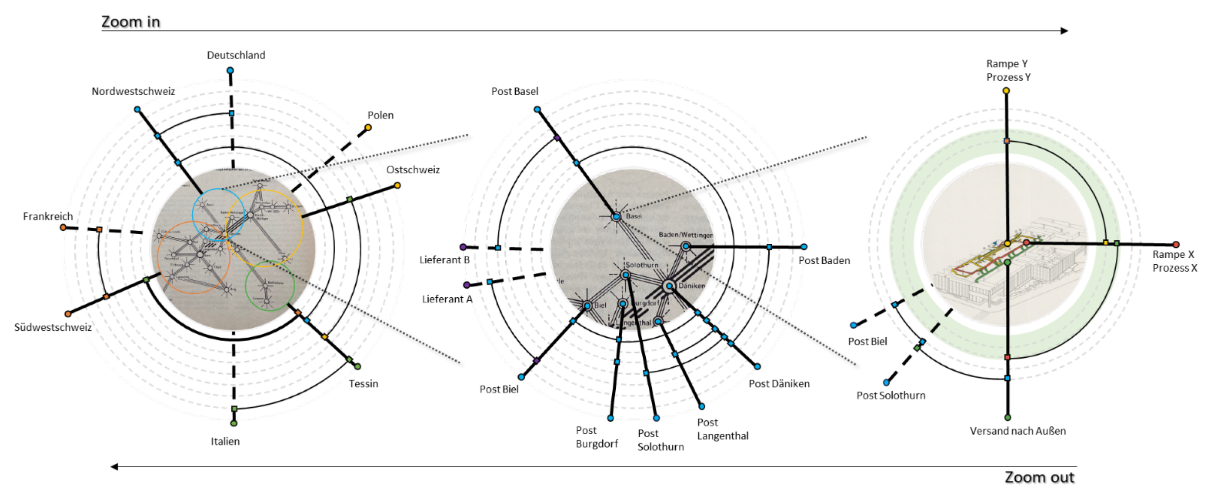
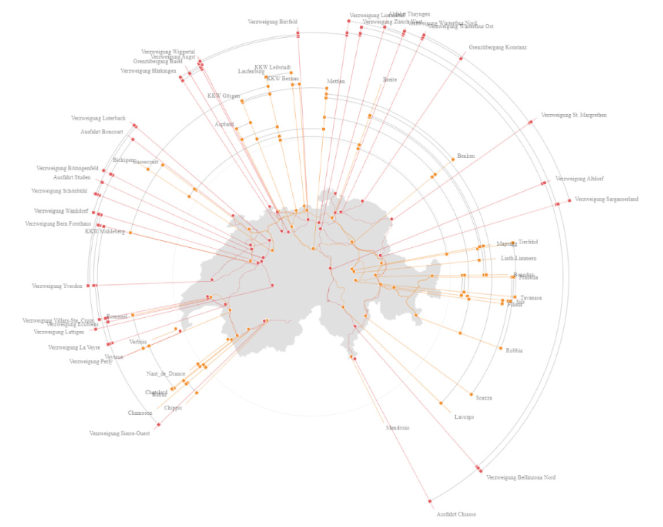
The integration of spatial and non-spatial entities within a single visualization remains challenging. Map-based approaches preserve geographic context but may require arbitrary placement of non-spatial elements, while network layouts may obscure spatial relationships, and multiple views can increase cognitive load. We present a coherent visualization concept that integrates spatial and non-spatial entities from different networks in a single view. The approach uses a radial layout centered on a map, where spatial entities retain their positions and non-spatial entities are arranged along a circular boundary. Relationships are represented as circular arcs on concentric layers, with markers indicating connections, thereby reducing overlap and improving readability. Interactive prototypes implemented in D3.js demonstrate variations in layout, interaction, and data complexity. The results show that radial, map-based network visualizations can support the integrated analysis of spatial and non-spatial relationships while preserving both geographic context and network structure.
Figures
BibTeX
@misc{bronowicz_radialnetwork_2026,
 abstract = {The integration of spatial and non-spatial entities within a single visualization remains challenging. Map-based approaches preserve geographic context but may require arbitrary placement of non-spatial elements, while network layouts may obscure spatial relationships, and multiple views can increase cognitive load. We present a coherent visualization concept that integrates spatial and non-spatial entities from different networks in a single view. The approach uses a radial layout centered on a map, where spatial entities retain their positions and non-spatial entities are arranged along a circular boundary. Relationships are represented as circular arcs on concentric layers, with markers indicating connections, thereby reducing overlap and improving readability. Interactive prototypes implemented in D3.js demonstrate variations in layout, interaction, and data complexity. The results show that radial, map-based network visualizations can support the integrated analysis of spatial and non-spatial relationships while preserving both geographic context and network structure.},
 author = {Bronowicz, Carolin and Bleisch, Susanne},
 booktitle = {EuroVisPosters 2026},
 doi = {10.2312/evpd.20261012},
 title = {Radial network visualization - Linking spatial and non-spatial networks in a connected circular layout},
 url = {https://diglib.eg.org/items/9d4bf661-b27f-4710-8247-5b55b9e65e47},
 year = {2026}
}