Visual Analytics for Sets over Time and Space (Dagstuhl Seminar 19192)
Report
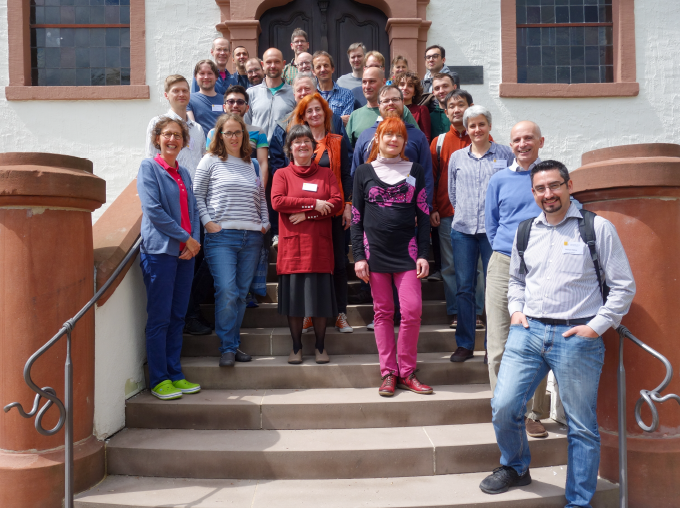
This report documents the program and the outcomes of Dagstuhl Seminar 19192 “Visual Analytics for Sets over Time and Space”, which brought together 29 researchers working on visualization (i) from a theoretical point …
Abstract
This report documents the program and the outcomes of Dagstuhl Seminar 19192 “Visual Analytics for Sets over Time and Space”, which brought together 29 researchers working on visualization (i) from a theoretical point of view (graph drawing, computational geometry, and cognition), (ii) from a temporal point of view (visual analytics and information visualization over time, HCI), and (iii) from a space-time point of view (cartography, GIScience). The goal of the seminar was to identify specific theoretical and practical problems that need to be solved in order to create dynamic and interactive set visualizations that take into account time and space, and to begin working on these problems.
Figures

BibTeX
@techreport{fabrikant_visualAnalyticsSpatTempSetsDagstuhl_2019,
 abstract = {This report documents the program and the outcomes of Dagstuhl Seminar 19192 “Visual Analytics for Sets over Time and Space”, which brought together 29 researchers working on visualization (i) from a theoretical point of view (graph drawing, computational geometry, and cognition), (ii) from a temporal point of view (visual analytics and information visualization over time, HCI), and (iii) from a space-time point of view (cartography, GIScience). The goal of the seminar was to identify specific theoretical and practical problems that need to be solved in order to create dynamic and interactive set visualizations that take into account time and space, and to begin working on these problems.},
 author = {Fabrikant, Sara Irina and Miksch, Silvia and Wolff, Alexander},
 doi = {10.4230/DAGREP.9.5.31},
 institution = {Schloss Dagstuhl – Leibniz-Zentrum für Informatik},
 pages = {31--56},
 title = {Visual {Analytics} for {Sets} over {Time} and {Space} ({Dagstuhl} {Seminar} 19192)},
 url = {https://drops.dagstuhl.de/entities/document/10.4230/DagRep.9.5.31},
 year = {2019}
}