Graphical Aids to the Estimation and Discrimination of Uncertain Numerical Data
Abstract
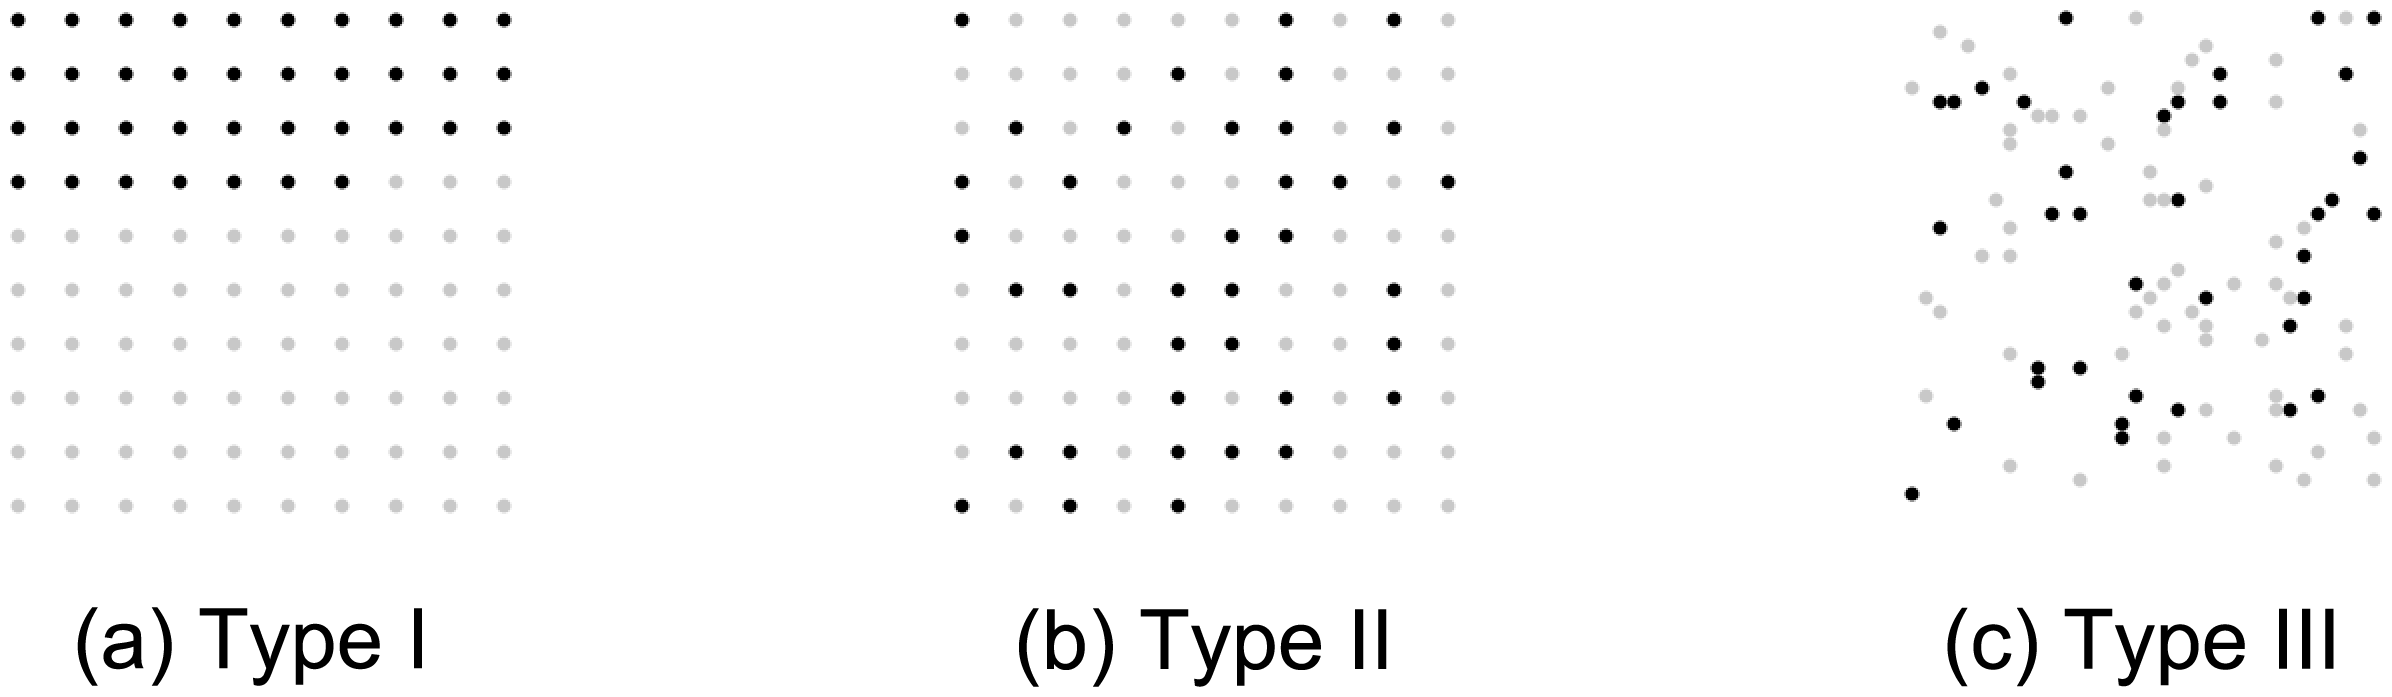
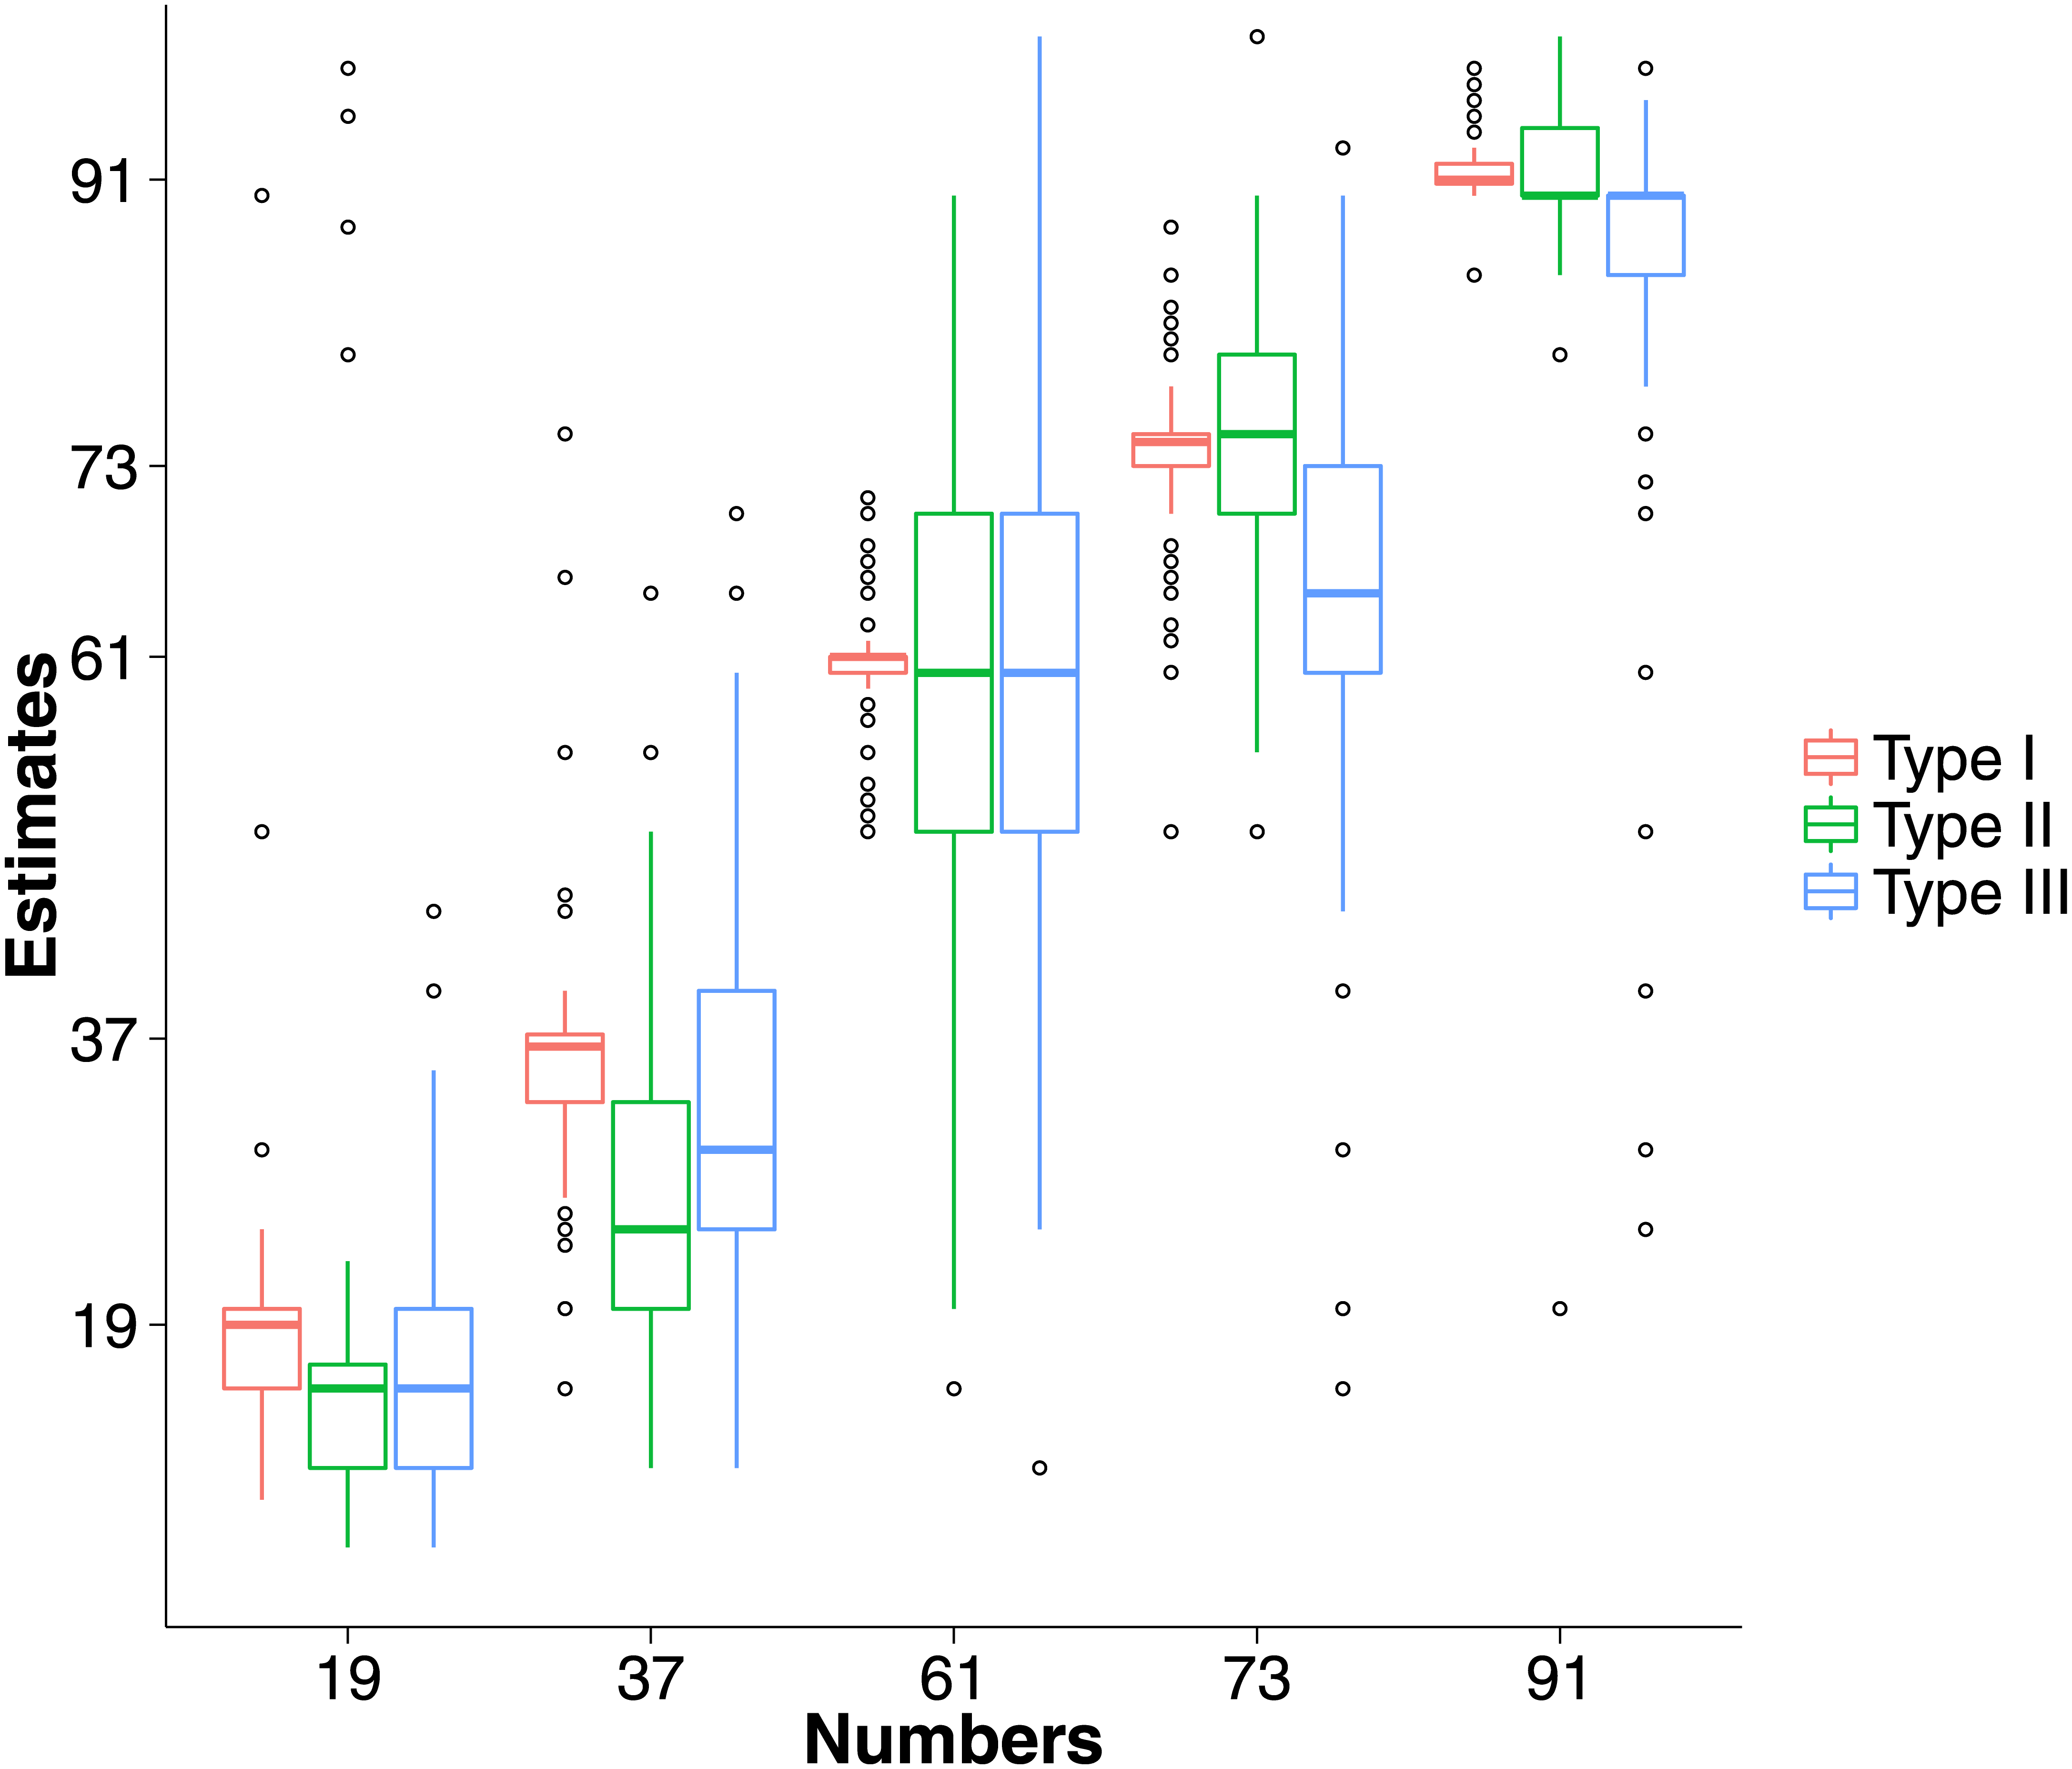
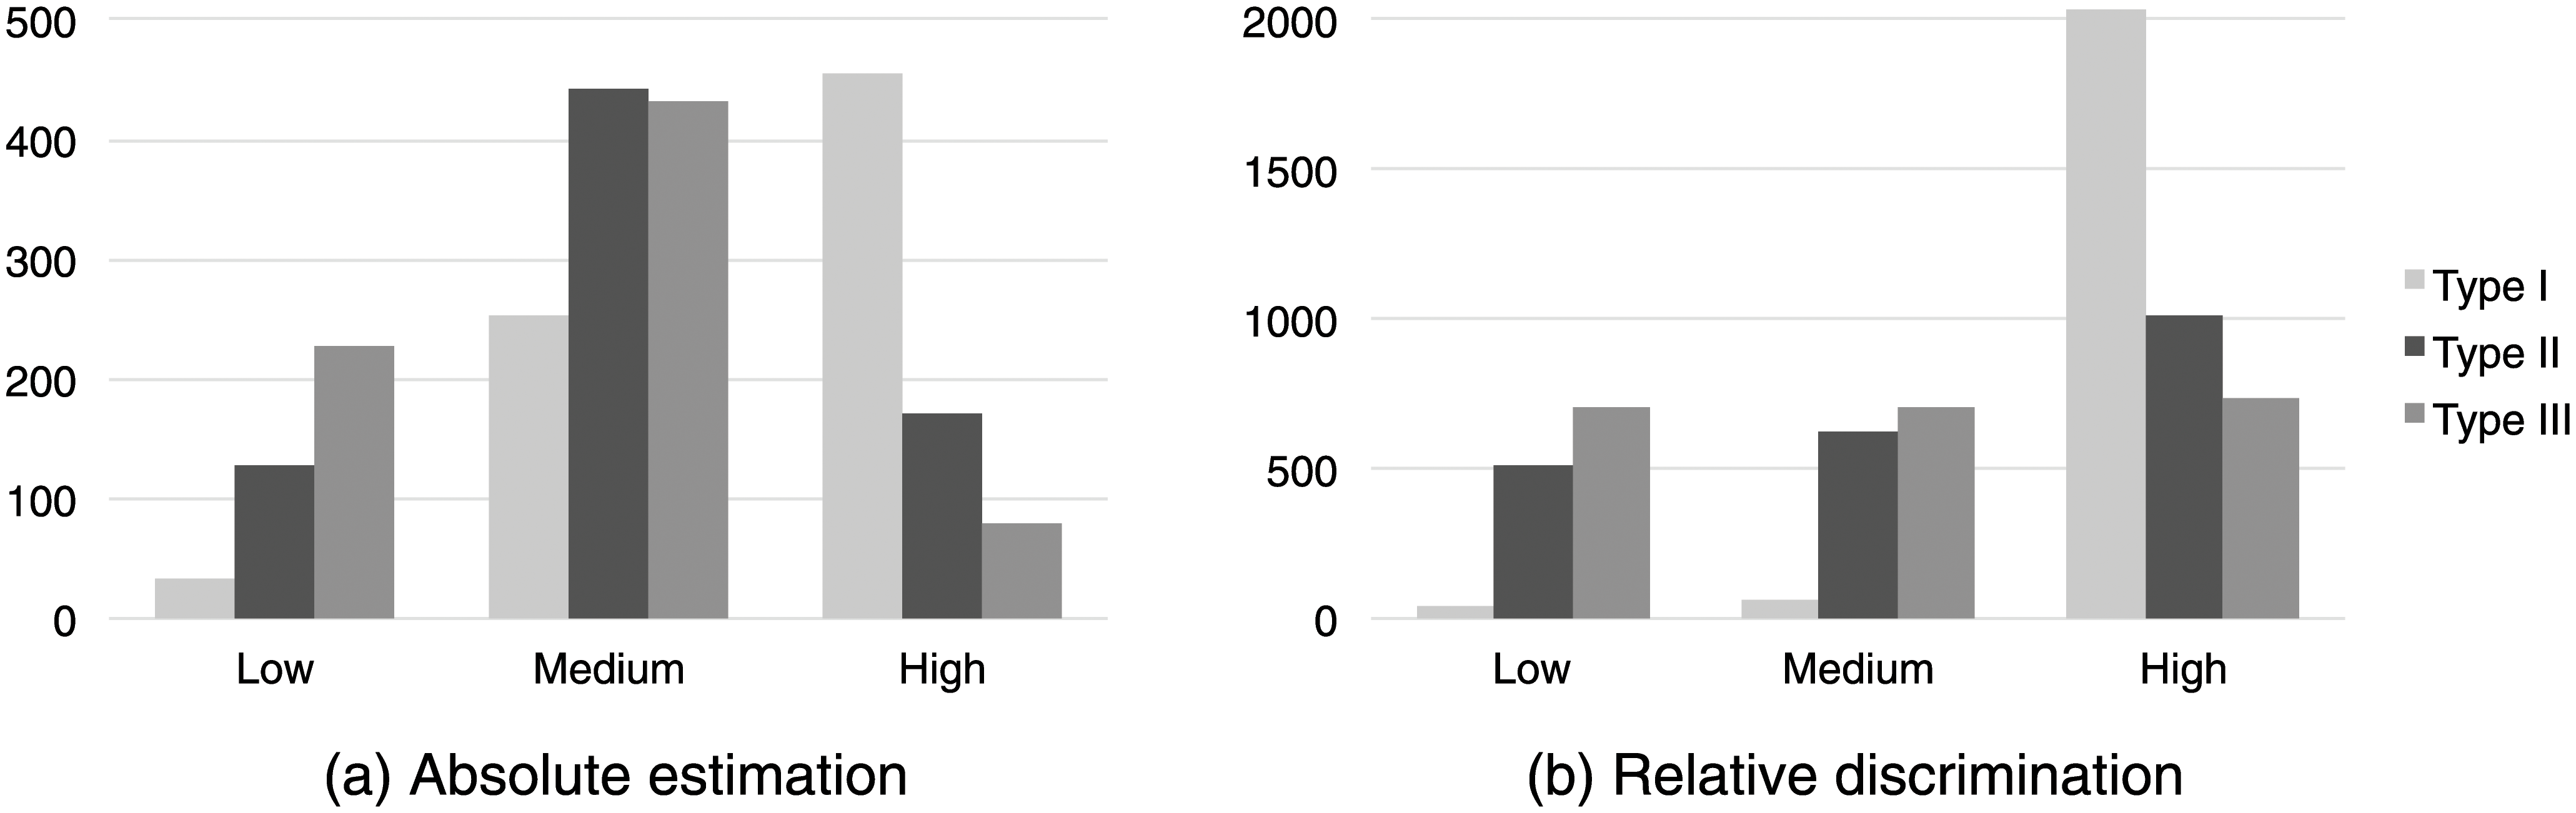
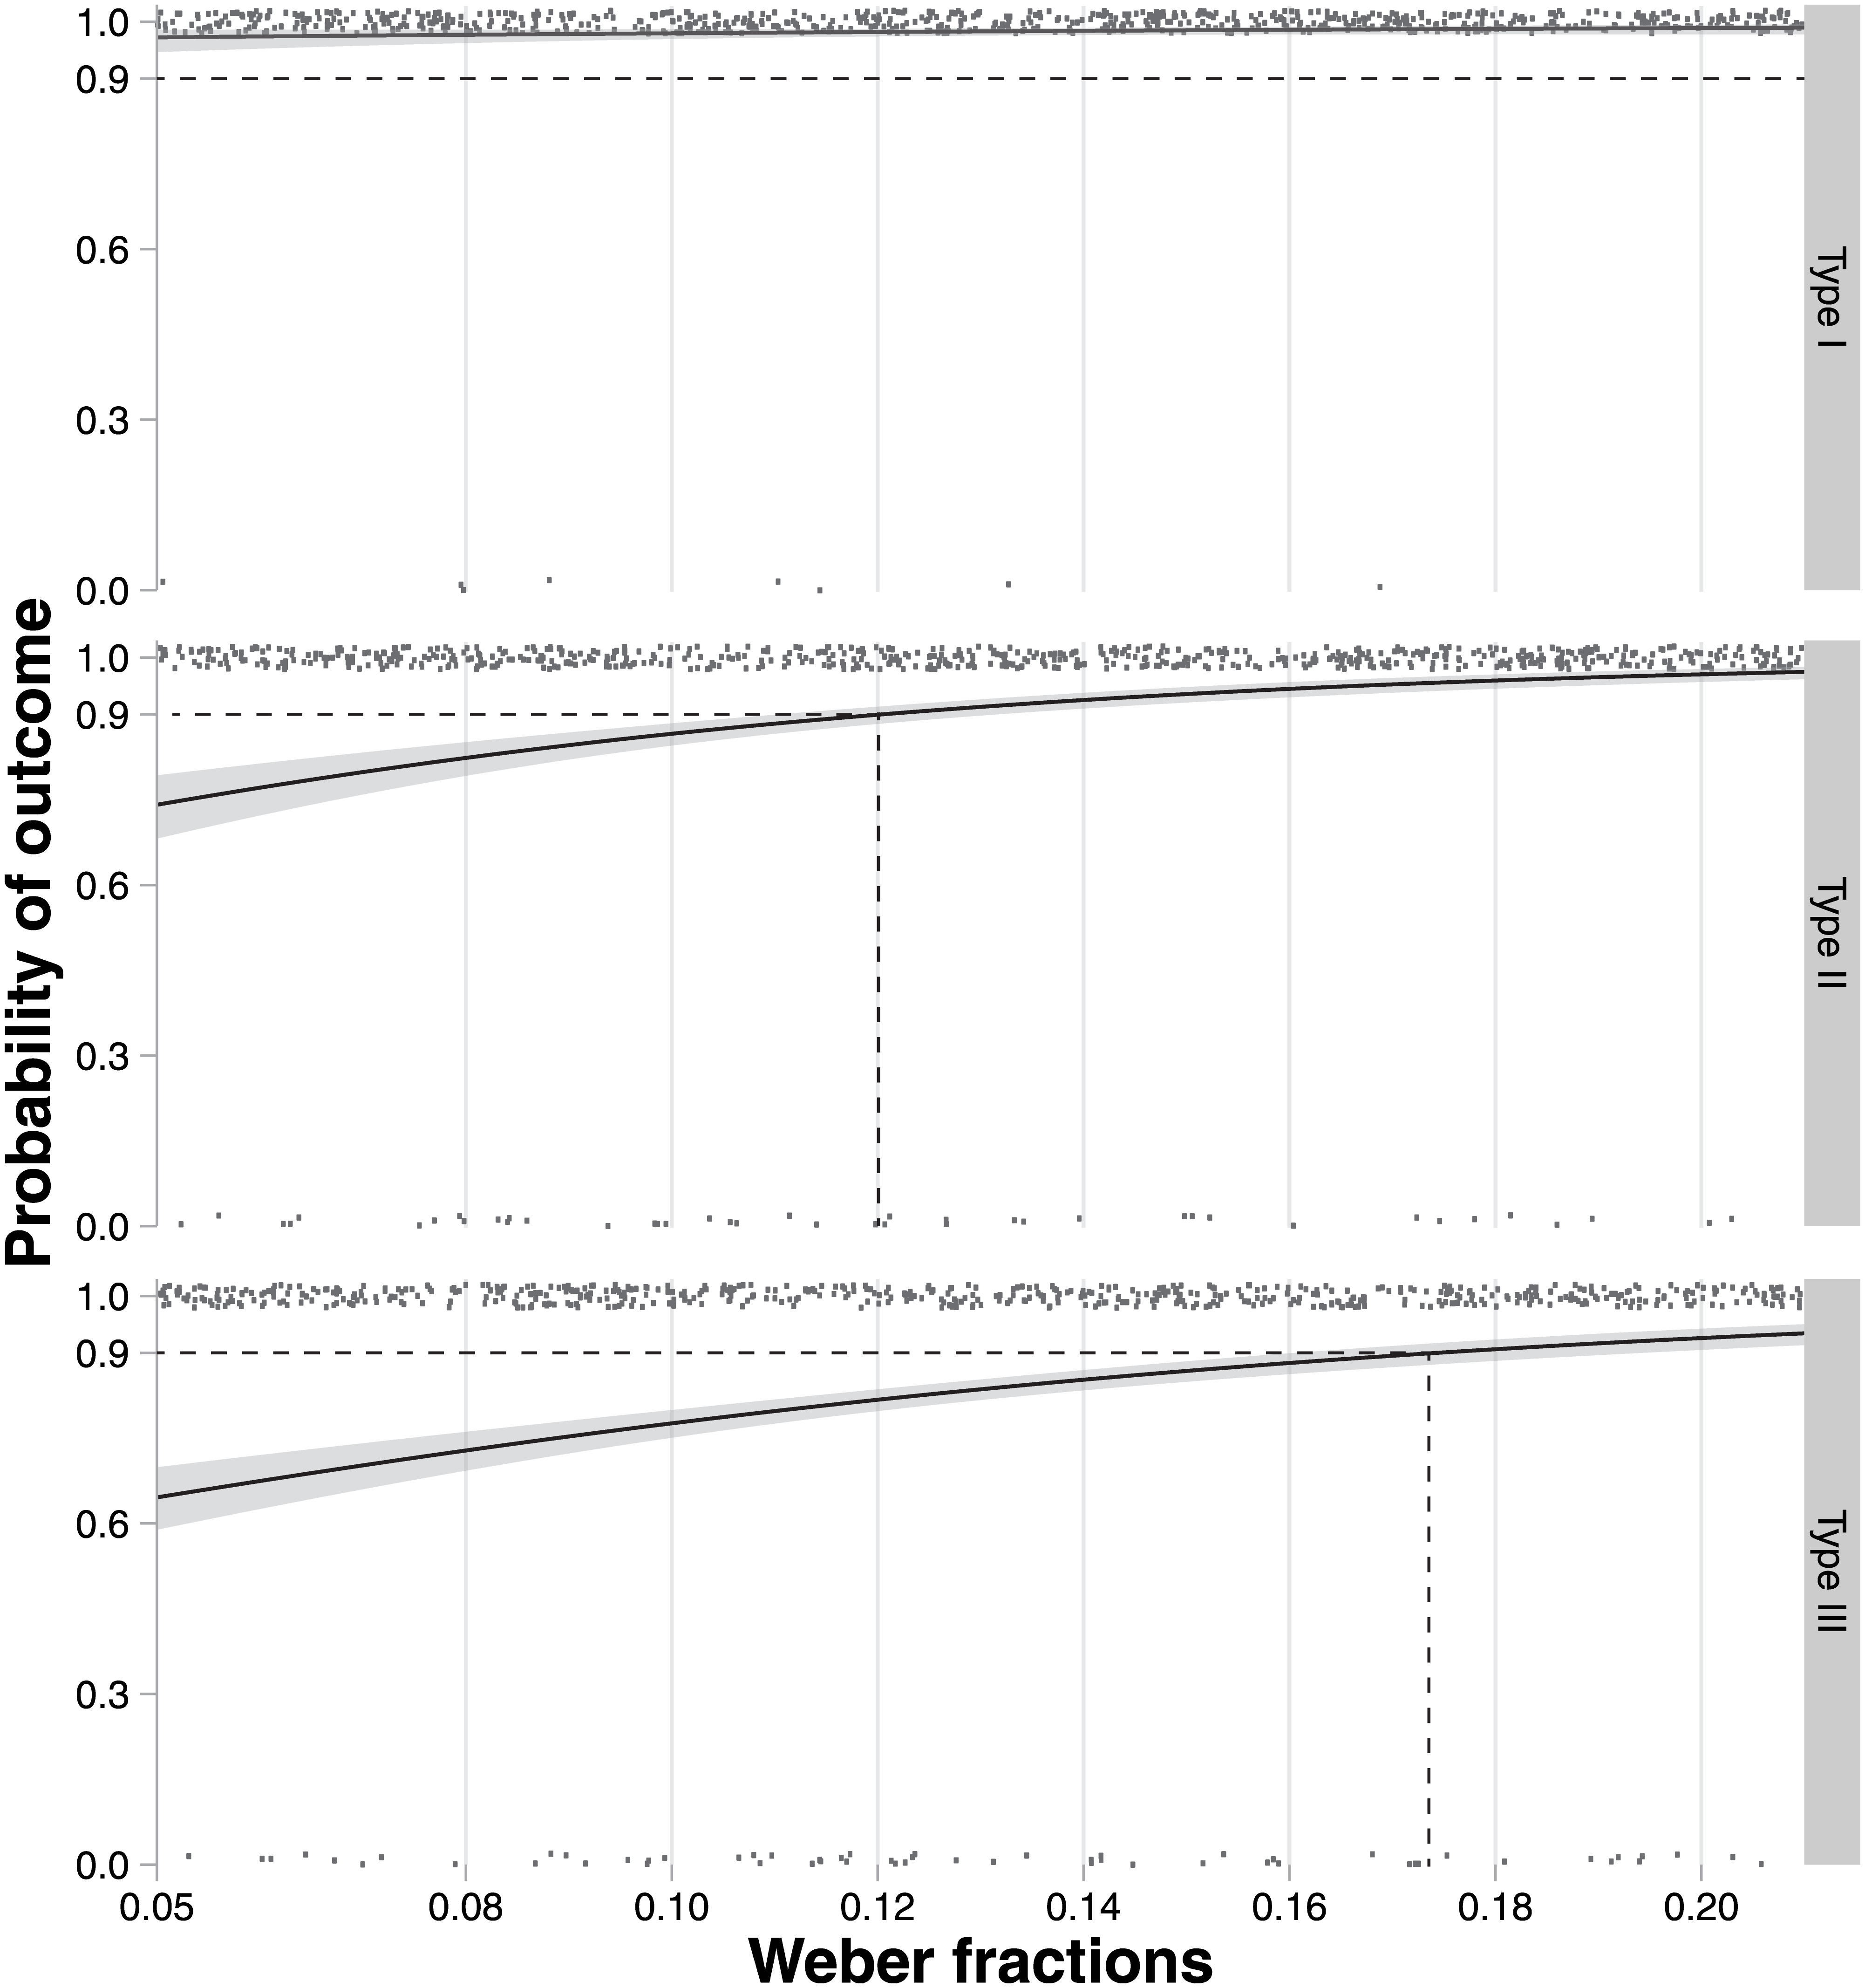
This research investigates the performance of graphical dot arrays designed to make discrimination of relative numerosity as effortless as possible at the same time as making absolute (quantitative) numerosity estimation as effortful as possible. Comparing regular, random, and hybrid (randomized regular) configurations of dots, the results indicate that both random and hybrid configurations reduce absolute numerosity estimation precision, when compared with regular dots arrays. However, discrimination of relative numerosity is significantly more accurate for hybrid dot arrays than for random dot arrays. Similarly, human subjects report significantly lower levels of subjective confidence in judgments when using hybrid dot configurations as compared with regular configurations; and significantly higher levels of subjective confidence as compared with random configurations. These results indicate that data graphics based on the hybrid, randomized-regular configurations of dots are well-suited to applications that require decisions to be based on numerical data in which the absolute quantities are less certain than the relative values. Examples of such applications include decision-making based on the outputs of empirically-based mathematical models, such as health-related policy decisions using data from predictive epidemiological models.
Figures
BibTeX
@article{jeong_graphicalAidsUncertainNumericalData_2015,
 abstract = {This research investigates the performance of graphical dot arrays designed to make discrimination of relative numerosity as effortless as possible at the same time as making absolute (quantitative) numerosity estimation as effortful as possible. Comparing regular, random, and hybrid (randomized regular) configurations of dots, the results indicate that both random and hybrid configurations reduce absolute numerosity estimation precision, when compared with regular dots arrays. However, discrimination of relative numerosity is significantly more accurate for hybrid dot arrays than for random dot arrays. Similarly, human subjects report significantly lower levels of subjective confidence in judgments when using hybrid dot configurations as compared with regular configurations; and significantly higher levels of subjective confidence as compared with random configurations. These results indicate that data graphics based on the hybrid, randomized-regular configurations of dots are well-suited to applications that require decisions to be based on numerical data in which the absolute quantities are less certain than the relative values. Examples of such applications include decision-making based on the outputs of empirically-based mathematical models, such as health-related policy decisions using data from predictive epidemiological models.},
 author = {Jeong, Myeong-Hun and Duckham, Matt and Bleisch, Susanne},
 doi = {10.1371/journal.pone.0141271},
 issn = {1932-6203},
 journal = {PLOS ONE},
 number = {10},
 title = {Graphical {Aids} to the {Estimation} and {Discrimination} of {Uncertain} {Numerical} {Data}},
 url = {https://dx.plos.org/10.1371/journal.pone.0141271},
 urldate = {2026-03-25},
 volume = {10},
 year = {2015}
}