Circular icons to represent absolute values relating to areal features
Abstract
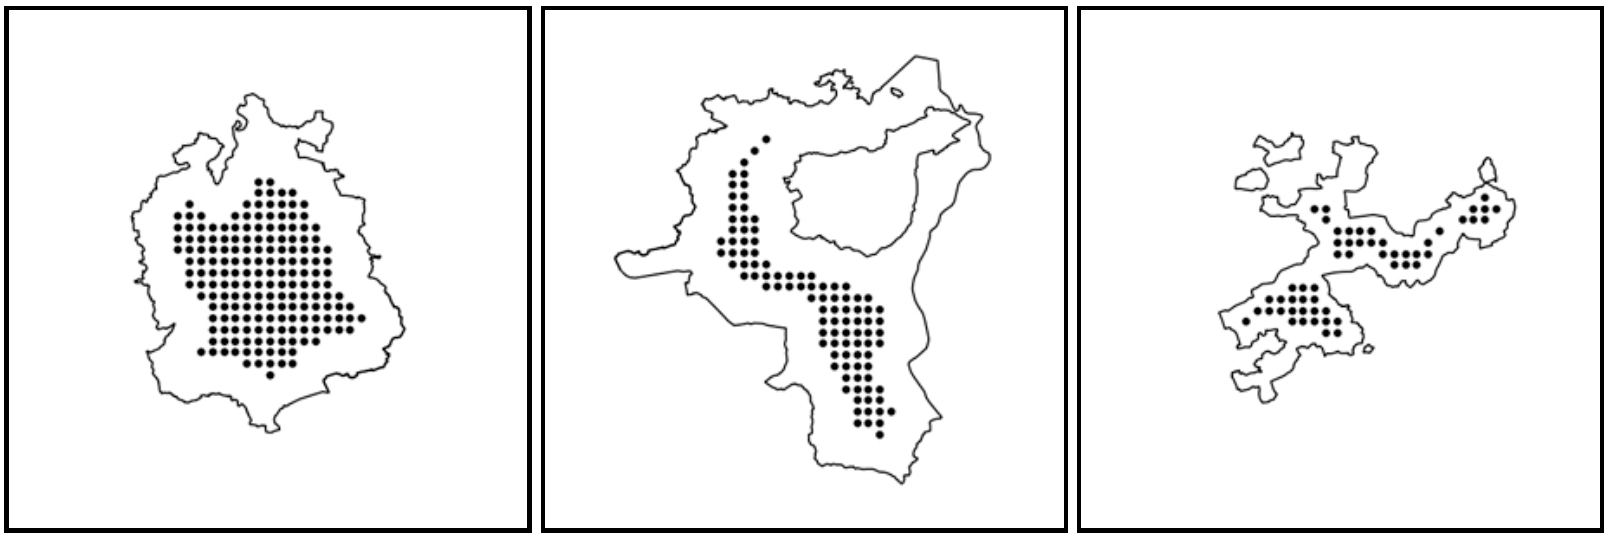
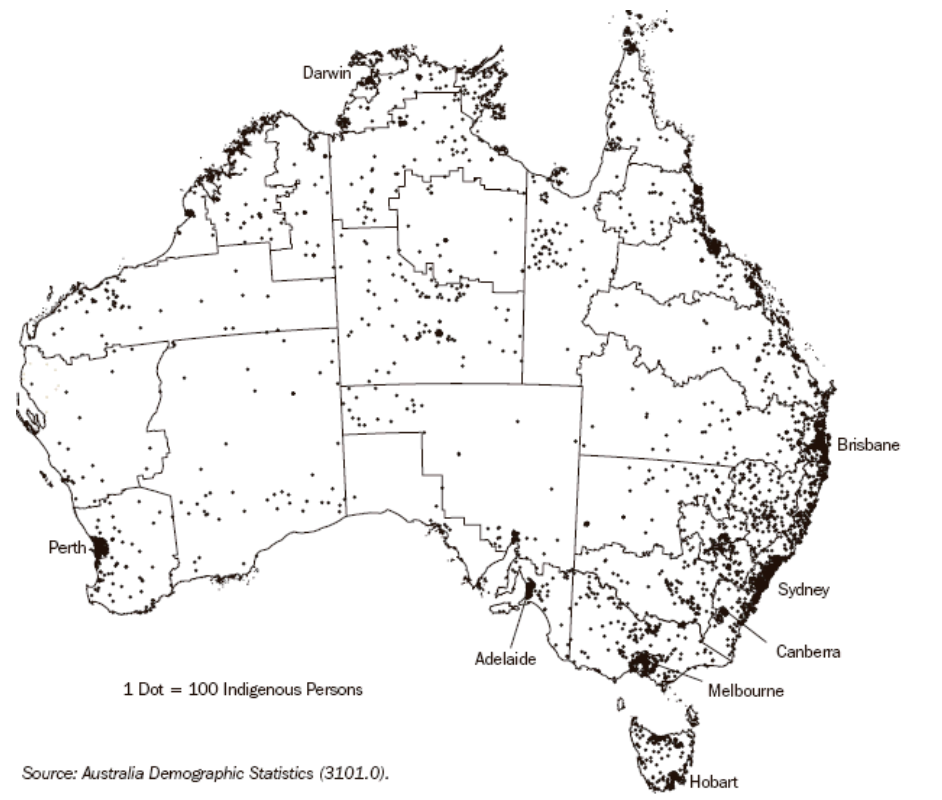
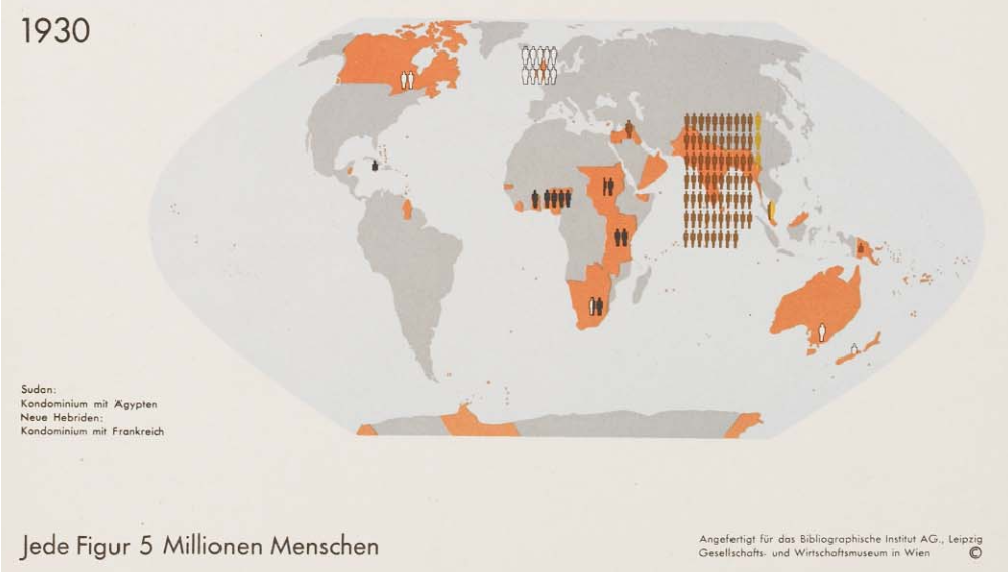
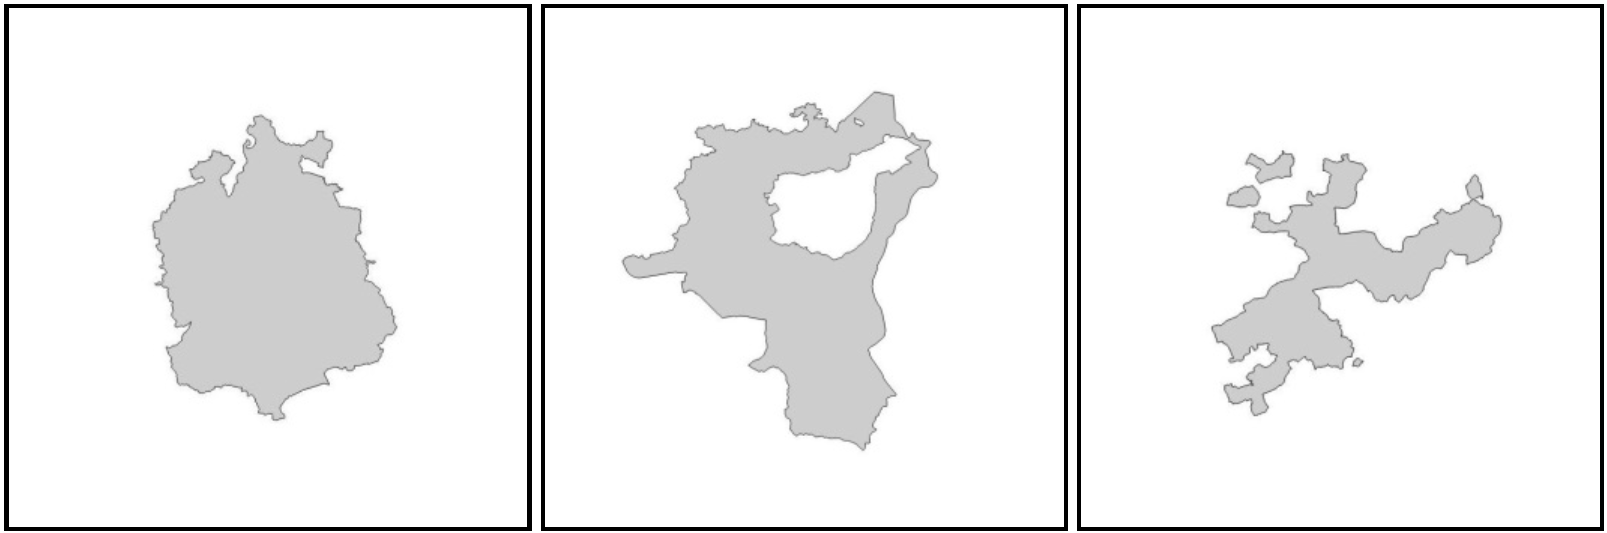
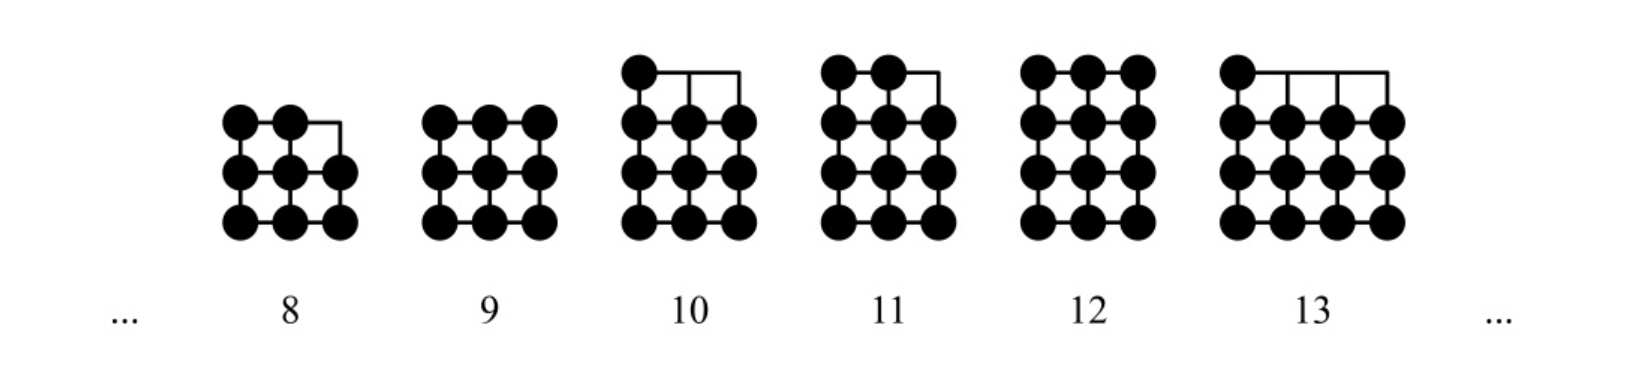
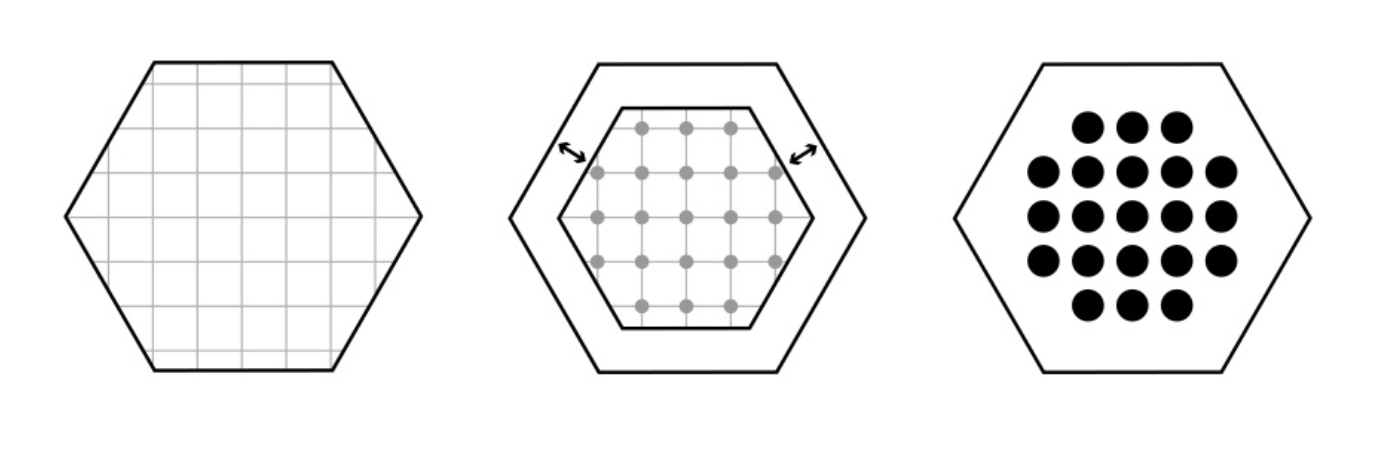
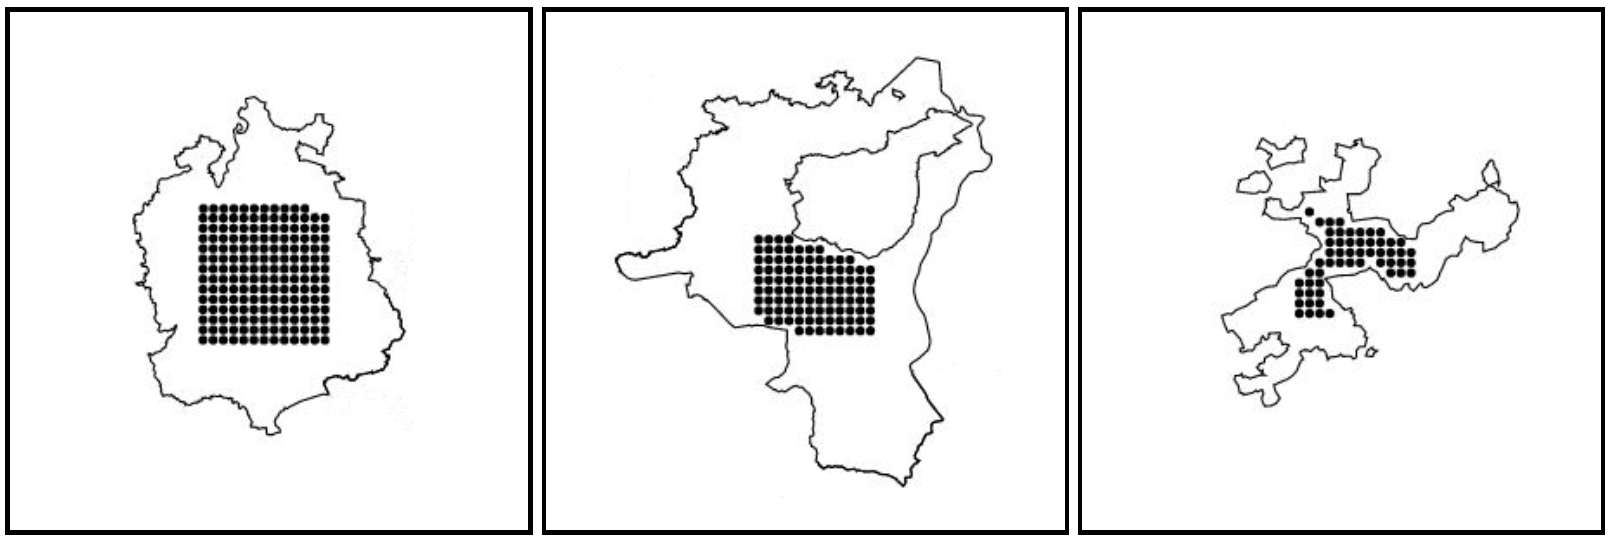
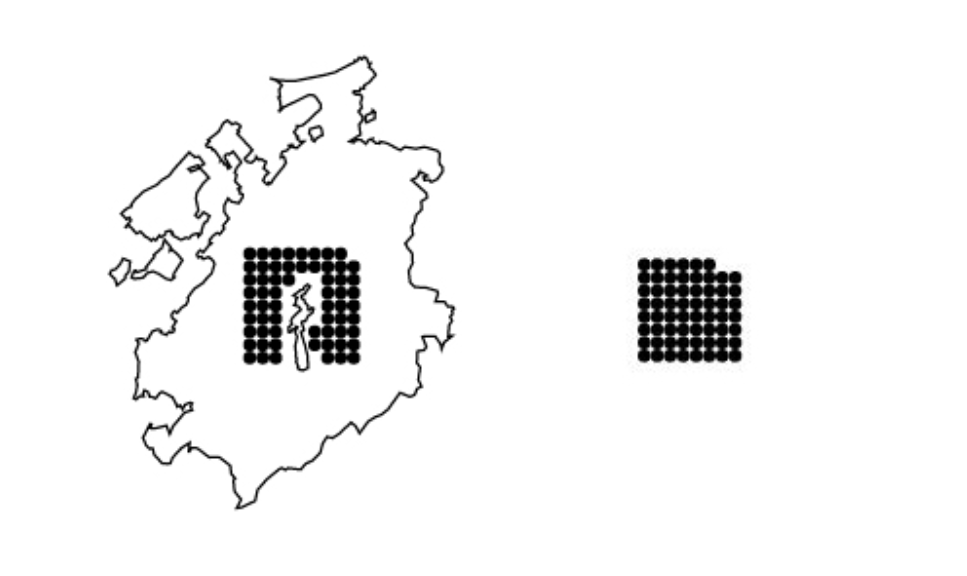
The Atlas of the Ageing Society required methods to represent absolute values relating to areal features. As most of the displays in the atlas employ dots as symbols we aimed at finding methods to represent quantitative values by an arrangement of dots. The arrangements need to work for a range of values and differently shaped areal features. Additionally, they should allow easy comparison of different values within a display. Some options for using dots as symbols on maps exist but none fulfills the specified requirements. We present two algorithms for dot arrangement. One is a squarish arrangement of dots that positions the dots in the center of the surrounding areal feature. The second is based on a regular grid. An inward buffer of the surrounding areal feature is applied to allow the correct number of dots to be contained within the area. Testing the two methods with different values and shapes yields promising results but also shows some limitations. Very large numbers or very small or irregular areal features remain a challenge. The presented methods will be applied and further tested in visualizations for the Atlas of the Ageing Society.
Figures
BibTeX
@article{meyer_circularIcons4AbsoluteValuesinAreas_2017,
 abstract = {The Atlas of the Ageing Society required methods to represent absolute values relating to areal features. As most of the displays in the atlas employ dots as symbols we aimed at finding methods to represent quantitative values by an arrangement of dots. The arrangements need to work for a range of values and differently shaped areal features. Additionally, they should allow easy comparison of different values within a display. Some options for using dots as symbols on maps exist but none fulfills the specified requirements. We present two algorithms for dot arrangement. One is a squarish arrangement of dots that positions the dots in the center of the surrounding areal feature. The second is based on a regular grid. An inward buffer of the surrounding areal feature is applied to allow the correct number of dots to be contained within the area. Testing the two methods with different values and shapes yields promising results but also shows some limitations. Very large numbers or very small or irregular areal features remain a challenge. The presented methods will be applied and further tested in visualizations for the Atlas of the Ageing Society.},
 author = {Meyer, Philipp and Studer, Thomas and Bleisch, Susanne},
 journal = {Proceedings of the ICA},
 title = {Circular icons to represent absolute values relating to areal features},
 url = {https://api.semanticscholar.org/CorpusID:49543929},
 year = {2017}
}