Square-glyphs: assessing the readability of multidimensional spatial data visualized as square-glyphs
Abstract
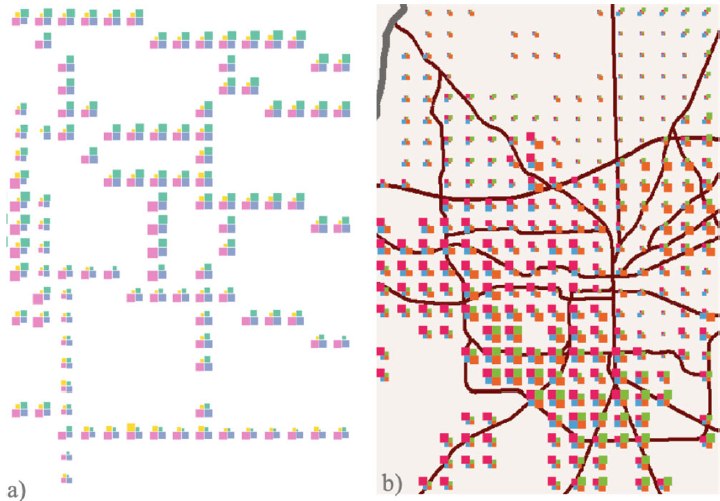
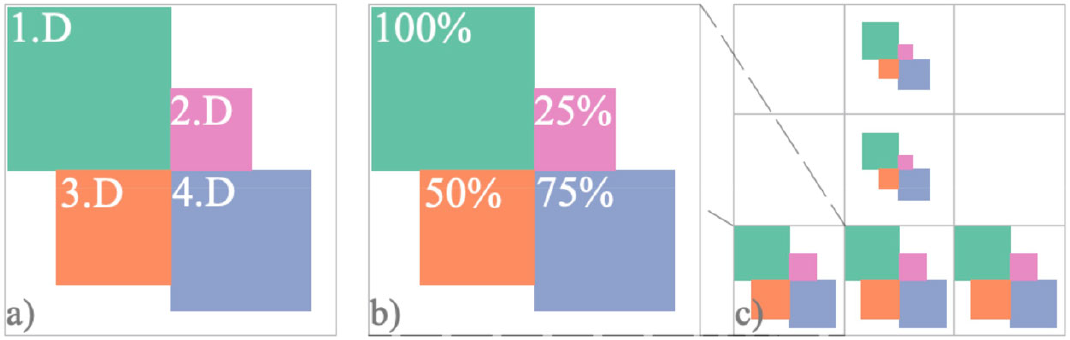
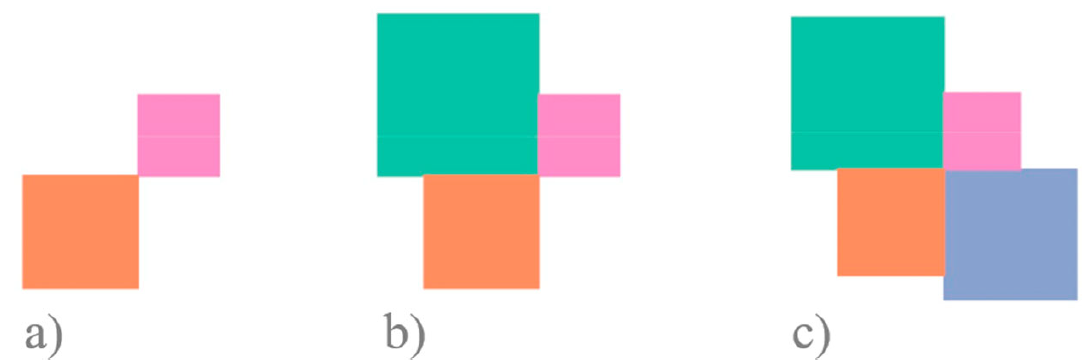
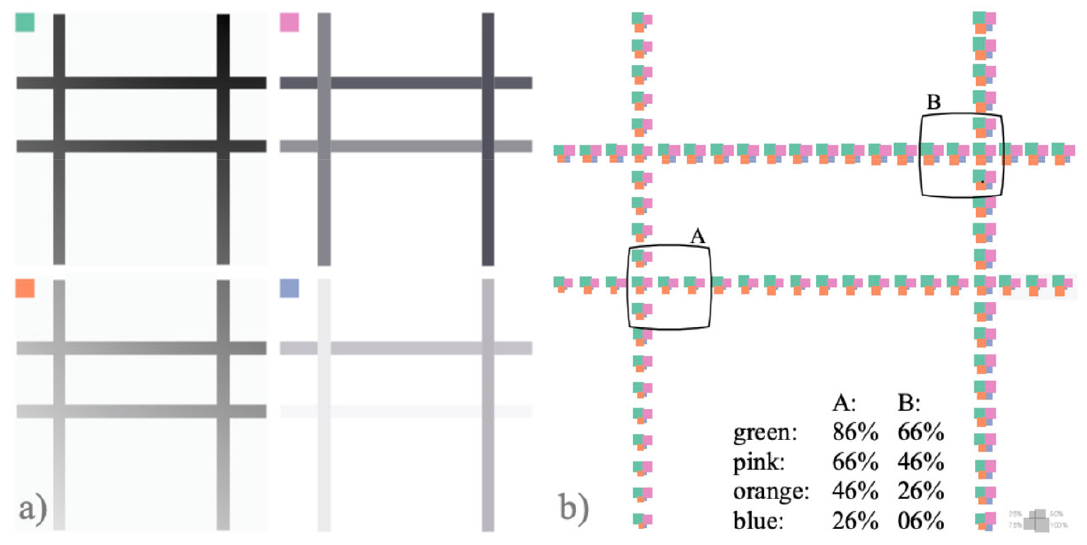
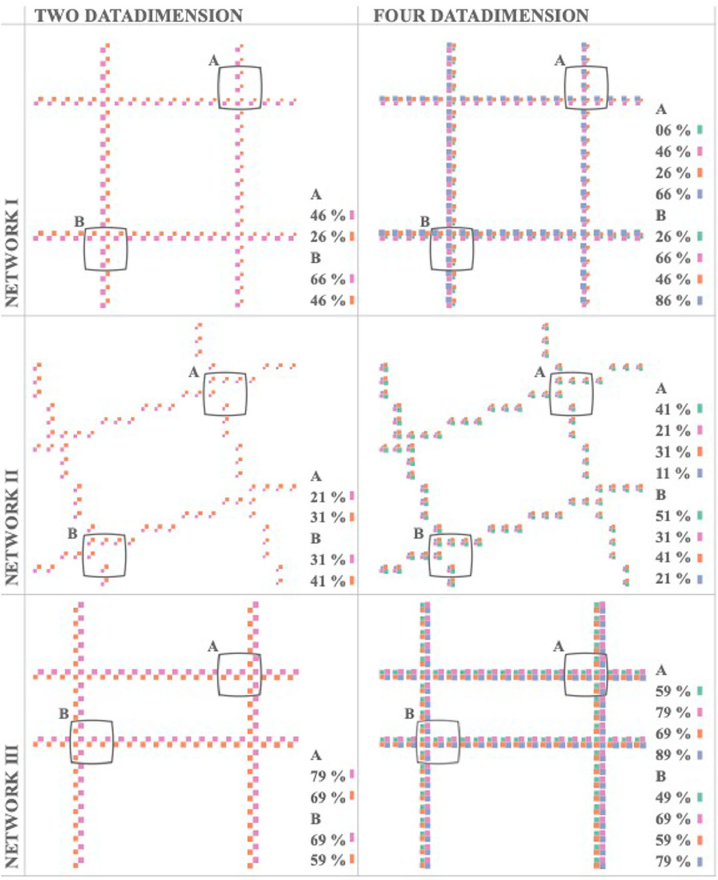
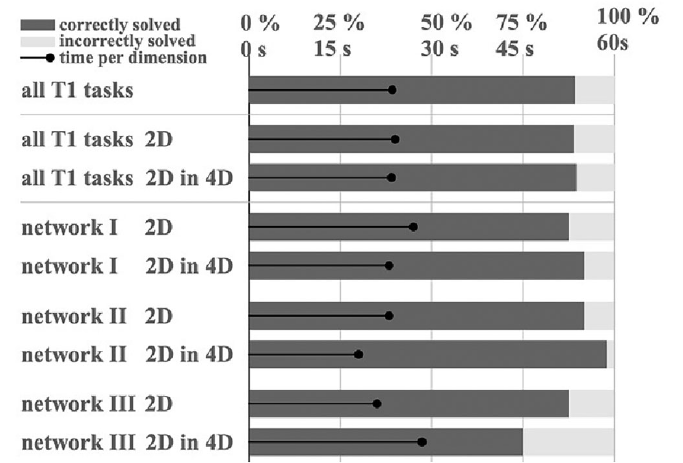
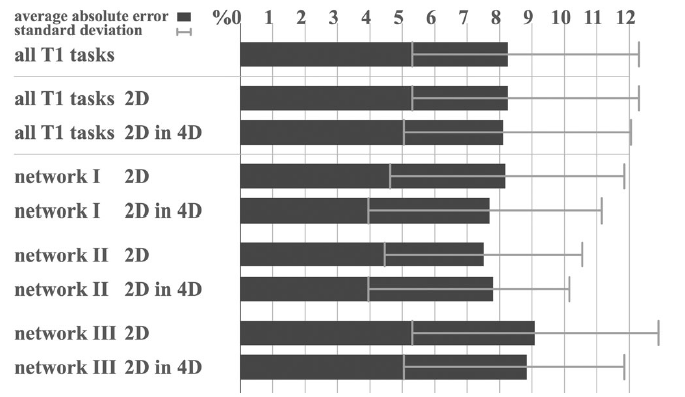
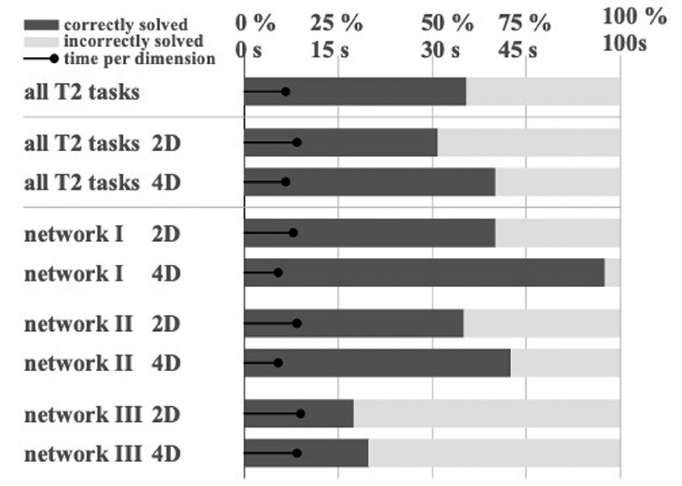
Glyphs have long been used to approach the challenge of visualising multidimensional data with geospatial reference. Depending on the glyph design, data-dense visualizations of several concurrent data dimensions can be created. The squareglyph is a compound glyph to represent up to four data dimensions, e.g. walkability indices, with reference to a gridded geographic space (Bleisch and Hollenstein 2018 [Exploring multivariate representations of indices along linear geographic features. Proceedings of the 2017 International Cartographic Conference, Washington D.C. (pp. 1–5)]). In this paper, we present a user study to evaluate the readability and interpretability of the square-glyphs. We compare user performance with square-glyph plots containing two and four simultaneously mapped data dimensions under different value compositions. Our results show that the user performance with square-glyphs does not decrease as the number of data dimensions represented increases from two to four. The study results indicate no significant differences in efficiency and effectiveness between the four-dimensional square-glyphs and the two-dimensional square-glyphs. The average values of five adjacent glyphs can be estimated with a mean error of eight percentage points. The results suggest that equal value distances between the displayed dimensions are more accurately perceived in a lower-value composition than in higher-value arrangements.
Figures
BibTeX
@article{muller_squareglyphs_2023,
 abstract = {Glyphs have long been used to approach the challenge of visualising multidimensional data with geospatial reference. Depending on the glyph design, data-dense visualizations of several concurrent data dimensions can be created. The squareglyph is a compound glyph to represent up to four data dimensions, e.g. walkability indices, with reference to a gridded geographic space (Bleisch and Hollenstein 2018 [Exploring multivariate representations of indices along linear geographic features. Proceedings of the 2017 International Cartographic Conference, Washington D.C. (pp. 1–5)]). In this paper, we present a user study to evaluate the readability and interpretability of the square-glyphs. We compare user performance with square-glyph plots containing two and four simultaneously mapped data dimensions under different value compositions. Our results show that the user performance with square-glyphs does not decrease as the number of data dimensions represented increases from two to four. The study results indicate no significant differences in efficiency and effectiveness between the four-dimensional square-glyphs and the two-dimensional square-glyphs. The average values of five adjacent glyphs can be estimated with a mean error of eight percentage points. The results suggest that equal value distances between the displayed dimensions are more accurately perceived in a lower-value composition than in higher-value arrangements.},
 author = {Müller, Gianna Daniela and Hollenstein, Daria and Çöltekin, Arzu and Bleisch, Susanne},
 doi = {10.1080/23729333.2023.2235492},
 journal = {International Journal of Cartography},
 number = {3},
 pages = {449--465},
 title = {Square-glyphs: assessing the readability of multidimensional spatial data visualized as square-glyphs},
 url = {https://www.tandfonline.com/doi/full/10.1080/23729333.2023.2235492},
 volume = {9},
 year = {2023}
}