How useful are interactive small multiples for the visualization of overlapping areal information? An expert evaluation in spatial planning
Abstract
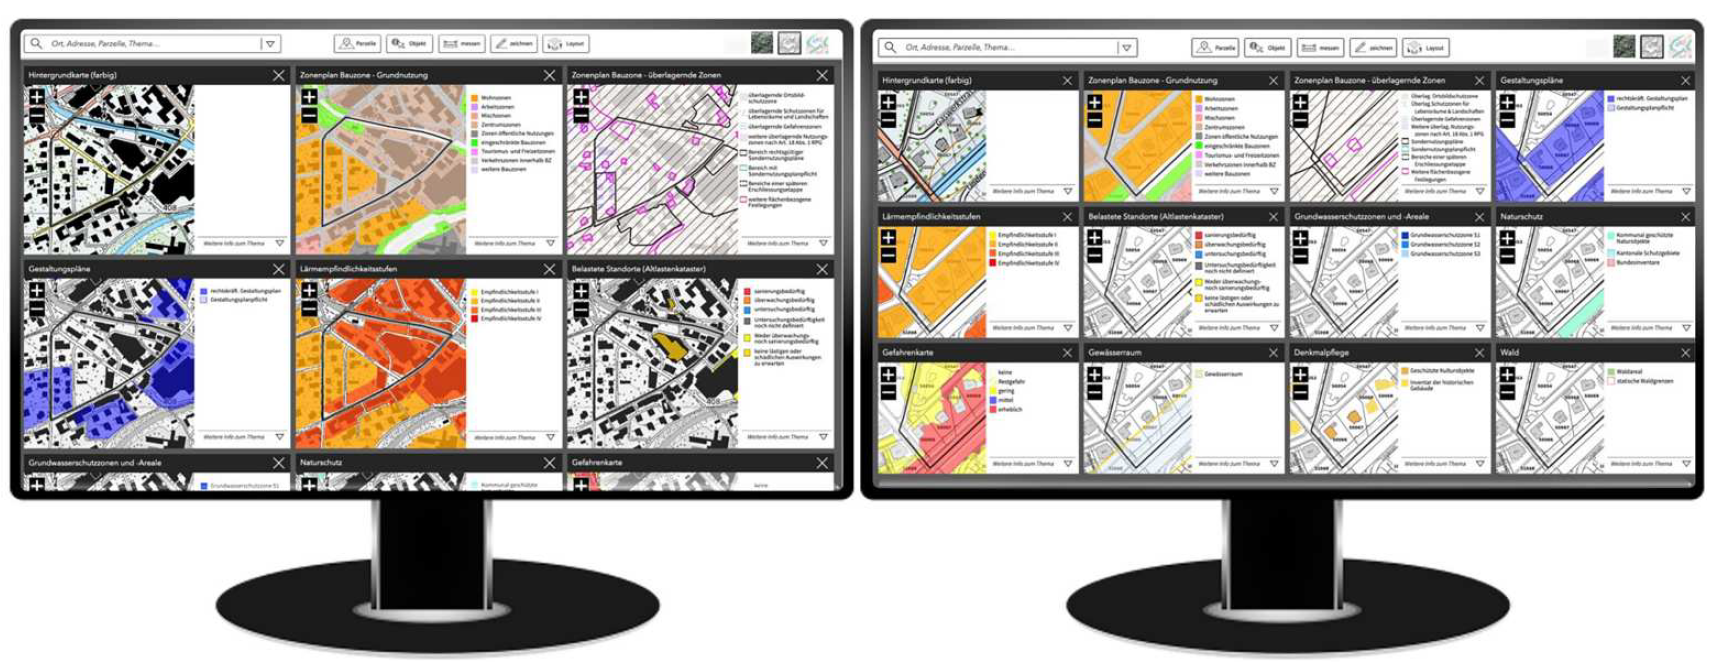
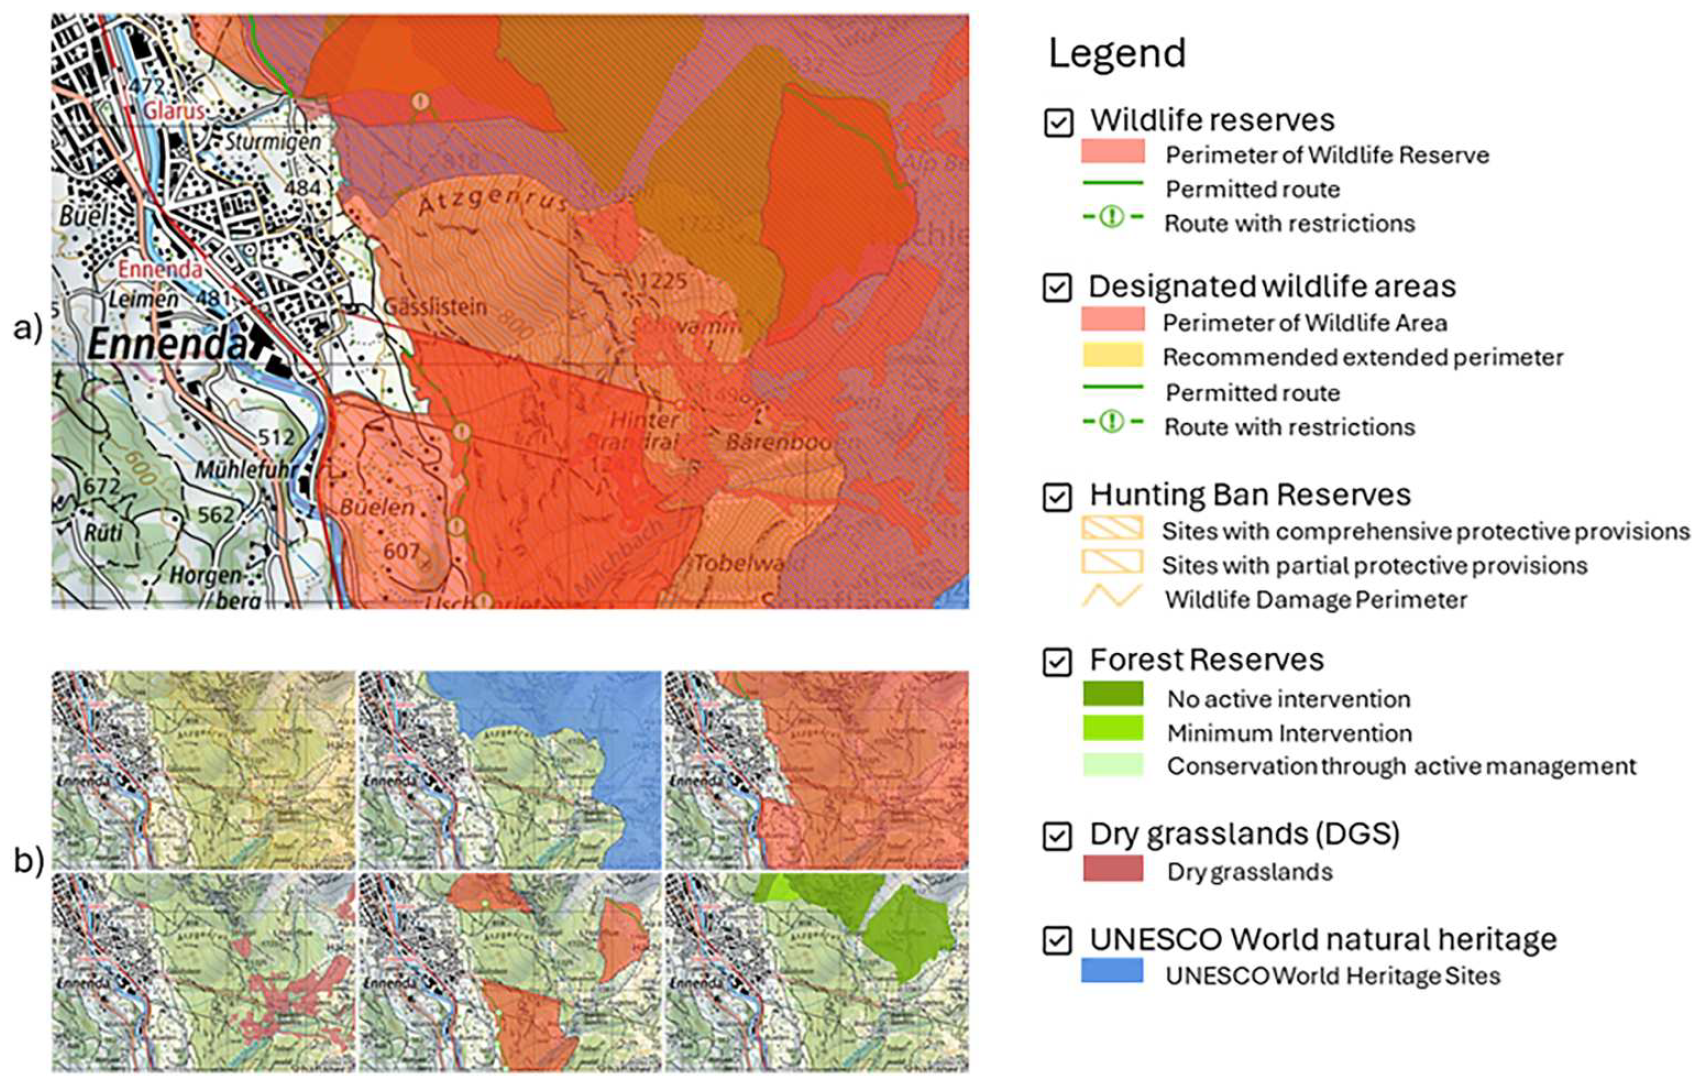
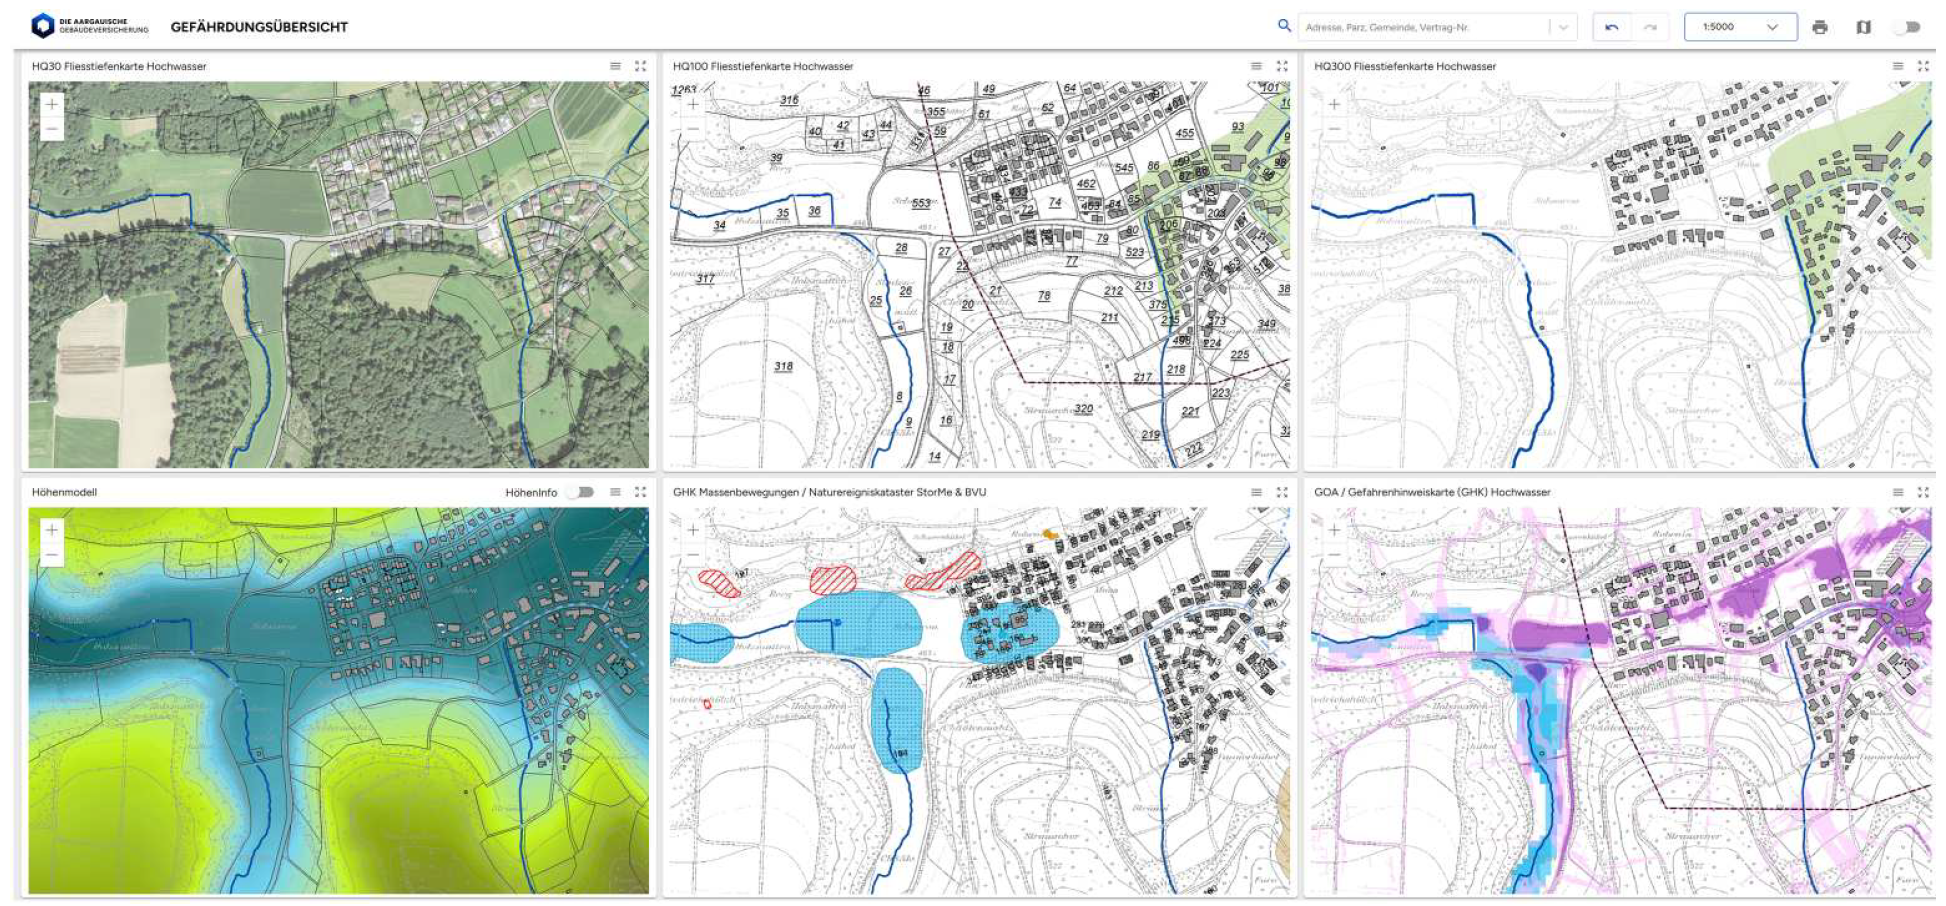
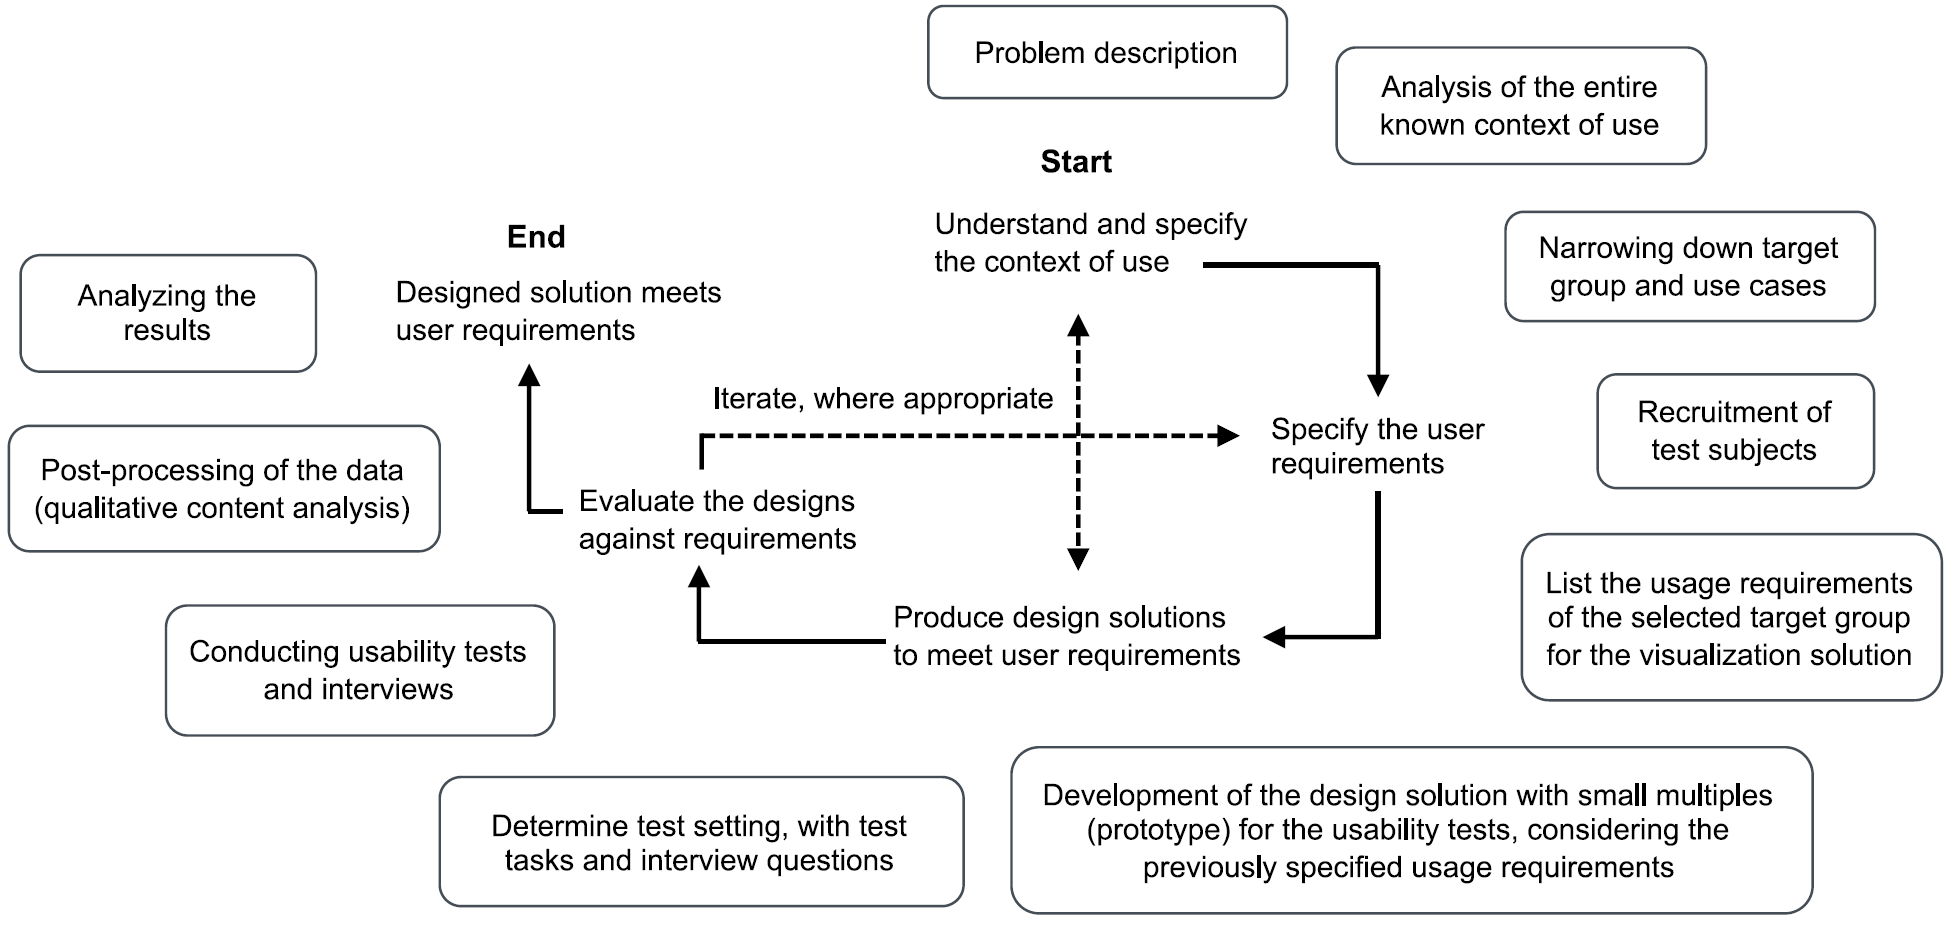
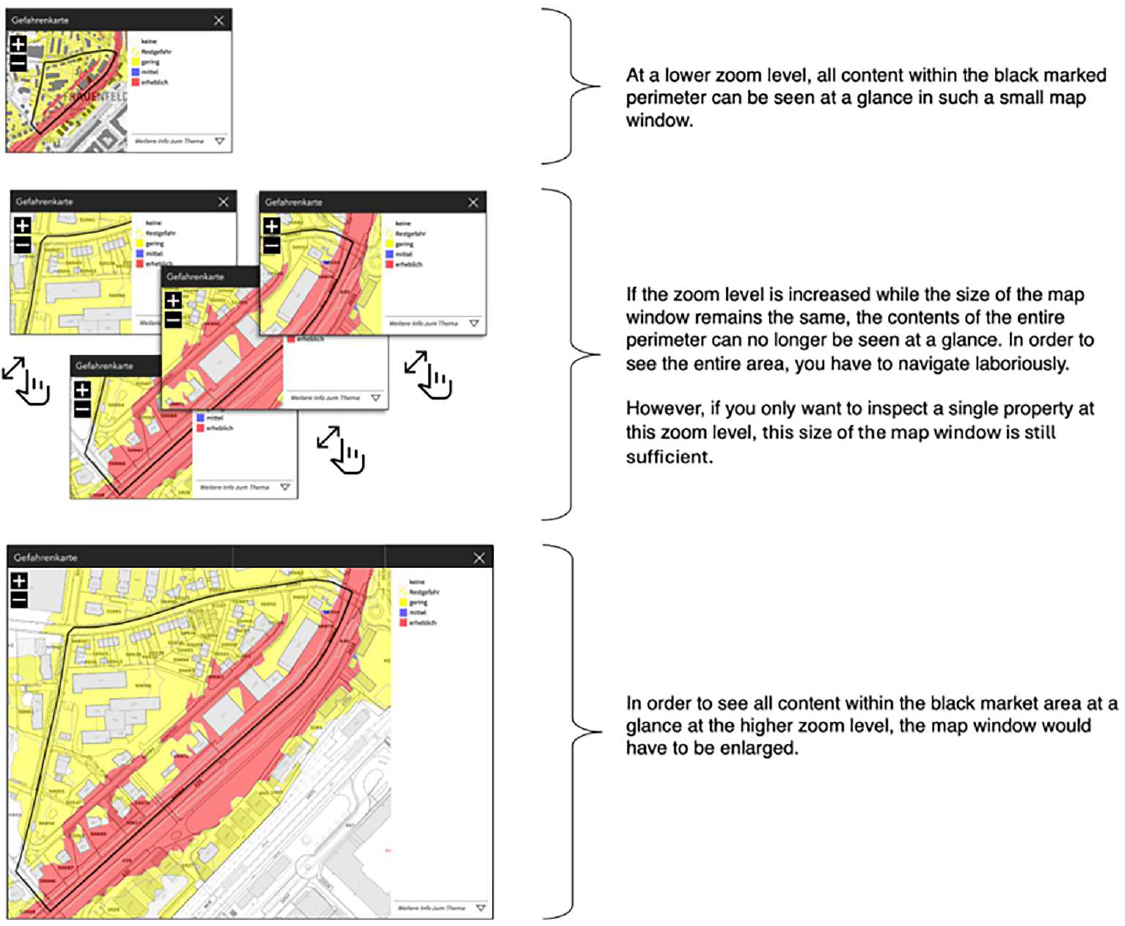
Multidimensional spatial data is used in various application domains, such as spatial planning or risk management. The datasets are often layered within single maps, where overlapping information can create complex and potentially misleading displays. This study investigates the use of an interactive small multiples layout, where web maps with a common spatial area, each representing a different topic, are arranged side by side for simultaneous viewing. Spatial planning served as the use case, as it involves the concurrent analysis of multiple topics within a defined area. Domain experts participated in a qualitative usability study, carrying out typical planning tasks. Their feedback on the small multiples layout regarding task effectiveness, efficiency, and satisfaction (usability) was evaluated through qualitative content analysis. We learned that the layout enabled quick overviews and efficient cross-comparison between topics, particularly in the weighing of interests. All tasks were completed, and the feedback was predominantly positive. Limitations arose when the area under consideration extended beyond the boundaries of the small multiples map windows. We conclude that small multiples layouts are useful for the simultaneous visual analysis of multiple spatially coincident topics in web maps. The finding may generalize to other domains that use potentially overlapping multidimensional spatial data.
Figures
BibTeX
@article{reutimann_smallmultiples_2026,
 abstract = {Multidimensional spatial data is used in various application domains, such as spatial planning or risk management. The datasets are often layered within single maps, where overlapping information can create complex and potentially misleading displays. This study investigates the use of an interactive small multiples layout, where web maps with a common spatial area, each representing a different topic, are arranged side by side for simultaneous viewing. Spatial planning served as the use case, as it involves the concurrent analysis of multiple topics within a defined area. Domain experts participated in a qualitative usability study, carrying out typical planning tasks. Their feedback on the small multiples layout regarding task effectiveness, efficiency, and satisfaction (usability) was evaluated through qualitative content analysis. We learned that the layout enabled quick overviews and efficient cross-comparison between topics, particularly in the weighing of interests. All tasks were completed, and the feedback was predominantly positive. Limitations arose when the area under consideration extended beyond the boundaries of the small multiples map windows. We conclude that small multiples layouts are useful for the simultaneous visual analysis of multiple spatially coincident topics in web maps. The finding may generalize to other domains that use potentially overlapping multidimensional spatial data.},
 author = {Reutimann, Salome and Bronowicz, Carolin and Bleisch, Susanne},
 doi = {10.1080/23729333.2026.2696783},
 journal = {International Journal of Cartography},
 title = {How useful are interactive small multiples for the visualization of overlapping areal information? {An} expert evaluation in spatial planning},
 url = {https://www.tandfonline.com/doi/full/10.1080/23729333.2026.2696783},
 year = {2026}
}